 Complex Landscape of Alternative Splicing in Myeloid Neoplasms
Leukemia

These authors contributed equally to this work
Author Contributions
C.E.H, R.A.P., and J.P.M., and T.H. conceptualized the project. C.E.H, R.A.P., and J.P.M., T.H., and M.A.S. prepared the manuscript, with contributions from all authors. C.M. Kerr assisted in sample preparation. C.E.H, D.C.M., V.A., C.H., N.N., S.T., S.H., M.M., W.W., C.B., W.K., and T.H. performed data curation. C.E.H performed formal analyses and D.C.M contributed to formal analyses for figures 4 and 6.

- Altmetric
Myeloid neoplasms are characterized by frequent mutations in at least seven components of the spliceosome that have distinct roles in the process of pre-mRNA splicing. Hotspot mutations in SF3B1, SRSF2, U2AF1 and loss of function mutations in ZRSR2 have revealed widely different aberrant splicing signatures with little overlap. However, previous studies lacked the power necessary to identify commonly mis-spliced transcripts in heterogeneous patient cohorts. By performing RNA-Seq on bone marrow samples from 1,258 myeloid neoplasm patients and 63 healthy bone marrow donors, we identified transcripts frequently mis-spliced by mutated splicing factors (SF), rare SF mutations with common alternative splicing (AS) signatures, and SF-dependent neojunctions. We characterized 17,300 dysregulated AS events using a pipeline designed to predict the impact of mis-splicing on protein function. Meta-splicing analysis revealed a pattern of reduced levels of retained introns among disease samples that was exacerbated in patients with splicing factor mutations. These introns share characteristics with “detained introns,” a class of introns that have been shown to promote differentiation by detaining pro-proliferative transcripts in the nucleus. In this study, we have functionally characterized 17,300 targets of mis-splicing by the SF mutations, identifying a common pathway by which AS may promote maintenance of a proliferative state.
Introduction
Myeloid neoplasms, including myelodysplastic syndromes (MDS), acute myeloid leukemia (AML), and myelodysplastic/myeloproliferative neoplasms (CMML, MDS/MPN-RS-T and MDS/MPN-U) are characterized by high somatic mutation rates in components of the spliceosome (1–3). Recurrent hotspot mutations have been observed in the spliceosomal factor genes SF3B1, SRSF2, U2AF1, PRPF8 and DDX41(1–3). Truncating mutations or chromosomal deletions have also been described in ZRSR2, LUC7L2, DDX41 and PRPF8 (2–8). A role for dysregulated alternative splicing (AS) in malignancies had been described before these splicing factor (SF) gene mutations were discovered, but the high frequency of specific SF mutations is unique to myeloid neoplasms among cancers. These seven SFs have been identified in different spliceosomal complexes and interact differently with pre-mRNA (9). Concordantly, patients harboring these mutations experience different clinical phenotypes, responses to therapies and outcomes (4, 6, 10–15). Therefore, it is likely that common mis-splicing events contribute to pathogenesis, yet there are mutation-specific alterations that explain the morphologic and clinical diversity of cases affected by different mutations in and deletions of SFs.
Previous work using engineered cell lines characterized the mechanisms by which alternative splicing (AS) patterns result from missense mutations in SF3B1, SRSF2, U2AF1 and PRPF8, as well as loss of function mutations in ZRSR2 (1, 2, 4, 15–25). Genetically engineered murine models harboring mutations in SF3B1, SRSF2 and U2AF1 mimicked these general splicing patterns, but did not fully recapitulate the AS events observed in human cell lines, likely due to differences in AS between species (8, 12, 20, 23, 25–31). Both murine models and engineered human leukemic cell lines were instrumental in characterizing the molecular mechanisms of these mutated splicing factors but phenotypically, have not fully explained pivotal alterations explaining clonal expansion. Early AS analyses of patient samples confirmed that overall splicing patterns observed in model systems were present in patient bone marrow (2, 4, 6, 16–21, 23, 24, 26–29, 31–35). However, they were unable to provide a definitive list of splicing changes being limited by sample sizes (fewer than 10 patients harboring mutations) and disease heterogeneity. Studies that have included more patients have identified a more comprehensive list of splicing changes (8, 22, 36, 37), but focused on a single disease, missense mutations alone, and did not assess the functional consequences of the identified splicing changes.
Fully understanding alternative splicing patterns in malignancies is essential because AS often confers functional changes on the translated protein, potentially creating oncogenes or inactivating tumor suppressor genes. The aims of characterizing global mis-splicing in cancers are two-fold: to identify isoforms that confer pathogenicity and to identify biomarkers that could direct detection or treatment.
Materials and Methods
Sample collection, processing and sequencing
Bone marrow samples were collected between 09/2005–04/2017 and diagnosed (MDS, AML, MDS/MPN) using WHO 2016 guidelines. All patients gave written informed consent for scientific evaluations and the study was approved by the Internal Review Board and adhered to the tenets of the Declaration of Helsinki. 250ng of total RNA was prepared with the Illumina TruSeq Total Stranded RNA library preparation kit. Paired-end reads of 100bp were sequenced by the NovaSeq 6000 with median depth of 50 million reads per sample. Sequences were aligned using STAR(38) (STAR 2.5.0) to human reference genome hg19. DNA was prepared with Illumina TruSeq PCR free library prep kit and sequenced (paired-end) on NovaSeq 6000 or HiSeqX with median 100x coverage. DNA sequences were aligned to human reference genome hg19 using Isaac3 (Illumina).
Identifying somatic mutations and chromosomal deletions
Somatic mutations were called by Streka2 (Illumina) and filtered using an in-house pipeline (see supplementary methods). Copy Number Variation was derived from whole genome sequencing data using GATK4 (Broad Institute). Deletions of LUC7L2, DDX41, PRPF8 and ZRSR2 were confirmed by karyotype.
Gene Expression and Splice Junction Identification and Quantification
Gene counts were estimated with Cufflinks (v2.2.1) and normalized by applying Trimmed mean of M-values (TMM) normalization method(39). Novel splice junctions were identified by StringTie (40). Novel and annotated splice junctions were quantified by rMATS 4.0.1 (41) and filtered for coverage and variance. Upon grouping by SF mutation or SF expression, rMATS STAT was run to identify dysregulated AS events, p-values were adjusted for multiple hypothesis testing with Bonferroni correction (Qvalues ≤ 0.05 and inclusion level difference ≥ 5% were considered significant).
Hierarchical clustering
Unsupervised hierarchical clustering in figures 2c, supplemental figure 2e, supplemental figure 2f, supplemental figure 6a–h was performed using pheatmap (42).
Functional assessment of AS events
Inclusion coordinates of AS events were intersected with features from the Exon Ontology database(43). AS events that correlated with survival were identified using rMATS SURVIV (44) and p-values were adjusted with Bonferroni correction for multiple hypothesis testing. Gene Set Enrichment Analysis was performed on low-inclusion and high-inclusion groups using GSEA software (45) on the Hallmark Gene Sets. The genes containing excluded introns identified to be significant in 20 or 30 comparisons of SF groups and healthy controls were analyzed by Gene Ontology(46) (GO) for enrichment in a molecular function (FDR ≤0.05)
Identification of Disease Specific Splicing Events (DSSEs)
Splice junctions observed in disease samples with zero reads across junctions in the healthy bone marrow samples were selected. DSSEs were filtered for coverage: 3 reads covering the junction in a single sample, 20 reads covering the junction across the MDS or AML cohorts, and 10 samples with ≥ 10% exclusion and 0 reads across all GTEX tissues. DSSEs were translated, the reading frame confirmed by blastp, and tested for binding to MHC class I using NetMHC (HLA supertypes, 9mer peptide sequences, ≥Rank % 2).
Additional method details are described in the Supplemental Materials, code used to perform analyses is available in our Github repository https://github.com/hershbc/AS_Analysis_myeloid_neoplasms. DNA and RNA sequences are available by request to Torsten Haferlach.
Results and Discussion
Seven splicing factors are frequently mutated in myeloid neoplasms
To identify alternative splicing (AS) patterns in myeloid neoplasms, we performed deep RNA next generation sequencing (NGS) on the bone marrow cells of 1,258 patients with myeloid neoplasms (MDS, AML, CMML, MDS/MPN) and 63 healthy bone marrow controls. In parallel, we performed whole genome sequencing to identify somatic variants (Supplemental Fig. 1a). We identified 728 patients harboring mutations or deletions in splicing factors DDX41, LUC7L2, PRPF8, SF3B1, SRSF2, U2AF1, and ZRSR2 (Fig. 1a). The proportion of SF mutations varied from 38–98% of each disease cohort (Fig. 1b). 1,177 patients (94%) harbored mutations in at least one SF gene and/or 66 non-SF myeloid neoplasm driver genes (Supplemental Fig. 1a). Previously documented hotspot mutations in SF genes (U2AF1S34, U2AF1Q157, SRSF2P95, and SF3B1K700, DDX41R525H, PRPF8D1598) were identified alongside rarely occurring and uncharacterized missense mutations in these genes (Supplemental Fig. 1b). Predicted loss of function (LoF) events (nonsense or frame shift mutations and chromosomal deletions) were also observed in DDX41, LUC7L2, PRPF8 and ZRSR2 (Supplemental Fig. 1b). Samples with hotspot mutations in U2AF1, SRSF2, and SF3B1 were mutually exclusive (Supplemental Fig. 1c)(1, 3, 7, 47). In contrast, 73/168 samples with LoF lesions in DDX41, ZRSR2, PRPF8 and LUC7L2 had an aberration in at least one other SF, although the variant allele frequency indicated they may not be in present in the same clone. (Supplemental Fig. 1d).
LoF mutations and chromosomal deletions result in decreased expression of SFs
Since LoF of LUC7L2 and ZRSR2 has been shown to impact hematopoietic differentiation (4, 48), we measured expression of these genes in all samples. Expression of LUC7L2 and ZRSR2 was decreased overall in myeloid neoplasms compared to healthy control samples, and patients harboring LoF lesions had further decreased expression of these genes (LUC7L2: fold change(FC)=0.79 Log2CPM p<0.001, DDX41: FC=0.86 Log2CPM p<0.001, PRPF8: FC=0.91 Log2CPM p<0.001, ZRSR2 Males: FC =0.85 Log2CPM p=0.00098) (Fig. 1c). We observed that many SF wild-type (SF WT) samples also exhibited low LUC7L2 and/or ZRSR2 levels, suggesting that mRNA levels of these two genes may be targeted by multiple mechanisms. Uncharacterized somatic mis-sense mutations, mutations within introns, or SNPs in LUC7L2 and ZRSR2 may contribute to the downregulation of these genes. Additionally, slow expression may be a secondary effect caused by a dysregulated transcription factor or epigenetic modifier.
Conversely, DDX41 and PRPF8 showed elevated gene expression in disease samples compared to healthy controls. Therefore, patients harboring LoF lesions exhibited expression levels of DDX41 and PRPF8 that were closer to the range of expression observed in healthy controls. DDX41 and PRPF8 are the only two splicing factors that are targeted by both LoF and missense mutations in myeloid neoplasms. Rare germline DDX41 LoF mutations can predispose patients to develop MDS, often requiring a second hit to cause disease (5). PRPF8 missense mutations result in change of function, and patients with lower expression are known to exhibit fewer AS changes than those with missense mutations (6).
Identification and quantification of annotated and unannotated splice junctions
The potential for activation of novel splice sites and the limited annotation of existing isoforms led us to identify AS events de novo by creating a custom splicing annotation for our cohort. Over 5×10⁵ potential splicing events supported by RNA sequencing data were annotated by StringTie and quantified by rMATS. Stringent filtering (see methods) resulted in 170,006 AS events with good sequencing coverage (Supplemental Fig. 2a). For each patient, we calculated percent spliced in (PSI) for alternatively spliced / skipped exons (SE), alternatively spliced / retained introns (RI), and use of alternative 5’ splice sites (A5SS) or alternative 3’ splice sites (A3SS) (Supplemental Fig. 2b). Alternatively spliced exons were the most prevalent AS event observed (Fig. 2a). As expected, analysis of PSI for each AS event revealed that the majority differed across the cohort by only 5–20%, but >1000 AS events had a range greater than 80% (Fig. 2b, Supplemental Fig. 2d). Ninety percent of these AS events had a mean inclusion level between 0–10% or 90–100%. Thus, a single isoform was often dominant among the transcripts that we quantified, and an even balance between inclusion and exclusion of a coding sequence was rare. (Supplemental Fig. 2c). Notably, the alternatively spliced exons we measured were most often included (mean PSI 90–100%), while the retained introns were most often removed (mean PSI 0–10%).
AS signatures cluster based on the presence of SF mutations, SF expression levels, and disease
Prior to dividing the cohorts by mutation and/or disease, we used unsupervised hierarchical clustering to identify groups of patients with common splicing signatures. Clustering of the 20,000 most variable AS events (those with the largest PSI range) of each type (SE, RI, A5SS, A3SS) revealed that SF mutation status alone does not explain AS differences between samples. Additional factors, such as low SF expression and disease, contributed to the splicing signatures of each patient. (Fig. 2c, Supplemental Fig. 2e). To better understand the similarities and differences of splicing patterns in patients that harbor missense mutations within the same splicing factor, while avoiding sub-clustering due to disease, samples in the MDS cohort containing SF3B1, U2AF1, and SRSF2 mutations were also independently clustered alongside SF WT samples. Previous studies have suggested that other mutations in SF3B1 heat repeats 5–9 are functionally similar to the K700E hotspot (16, 22, 32, 37). Indeed, we see that mutations in this region also co-cluster in our analysis (Supplemental Fig. 2f). Previous work has also suggested that mutations in the two zinc finger domains in U2AF1 have entirely separate targets (21, 22, 28) or form sub-clusters due to both common and distinct targets (37). Our data showed U2AF1 hotspot mutations forming sub-clusters. This suggests that patients harboring U2AF1S34 or U2AF1Q157 share some overlapping and some distinct dysregulated splicing or that the two mutations affect the same exon or intron, but in different ways. As expected, the various SRSF2 mutations encompassing P95 also generally co-clustered, including the P95-R102 deletion(20, 37).
Upon clustering of AS signatures, the samples harboring LoF in DDX41, LUC7L2, PRPF8 and ZRSR2 did not form groups (data not shown). However, when we annotated all patients in the lowest expression decile, irrespective of mutation, we observed distinct groups (Fig. 2c, Supplemental Fig. 2e). Low LUC7L2 and/or low ZRSR2 patients co-clustered and segregated distinctly from low DDX41 and/or low PRPF8 patients (Fig. 2c, Supplemental Fig. 2e). We observed some overlap between low LUC7L2 and low ZRSR2 groups, as well as between low DDX41 and low PRPF8 groups (Fig. 2d, Supplemental Fig. 2g). The mRNA levels of LUC7L2 and ZRSR2 are correlated, as are the mRNA levels of DDX41 and PRPF8 (Fig. 2d). The splicing signatures of samples with low DDX41 and low PRPF8 clustered with healthy controls. (Fig. 2c, Supplemental Fig. 2e) This is concordant with our observation that low DDX41 and low PRPF8 groups had similar expression levels to that of healthy controls (Fig. 1c). We also examined the distribution of non-SF mutations (Supplemental Fig. 2h) but none appeared to explain any of the additional clustering in AS signatures.
The results of our unsupervised clustering strengthened our confidence in our groupings for downstream AS analyses. We noted that AS events drive the formation of clusters that distinguish disease groups, with the differences between MDS and AML patients being the most dramatic. While we expected missense mutations in and around hotspots to cluster, samples with low expression of LUC7L2, ZRSR2, PRPF8 and DDX41 also exhibited distinct splicing signatures.
17,300 dysregulated AS events between SF groups, disease controls, and healthy controls
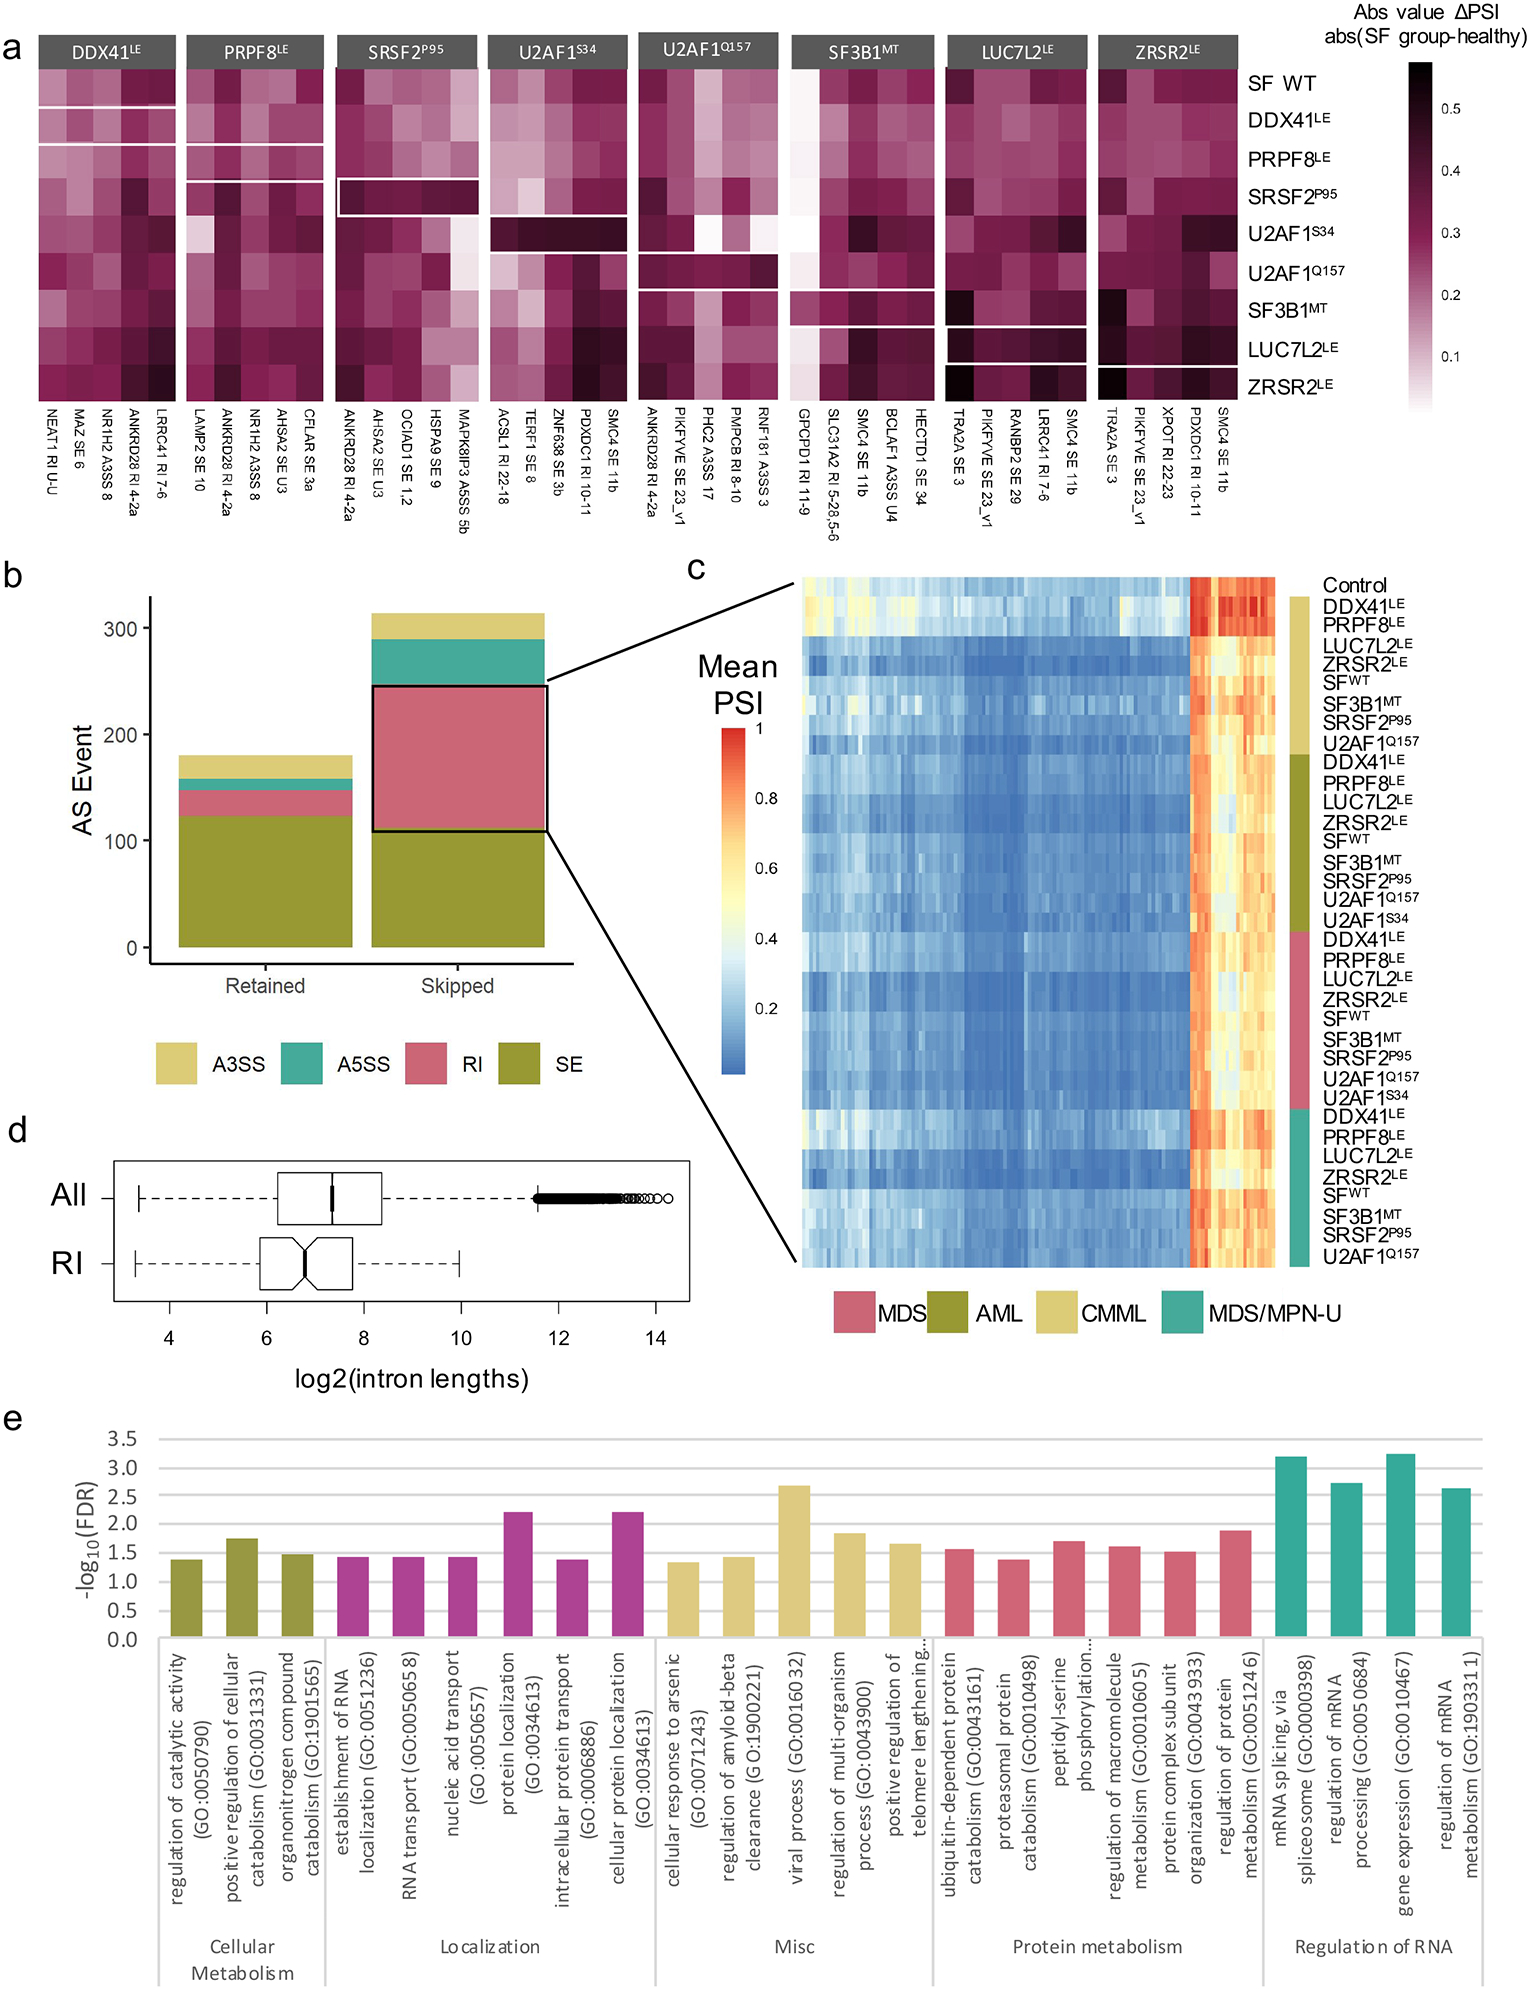
We identified distinct dysregulated AS events in molecularly-defined SF groups (stratified by disease type, co-clustering mutations, or SF low expression) that differed from disease controls (SF WT or SF high expression) or from healthy controls. These comparisons resulted in 17,300 AS events that were significantly dysregulated in at least one of 60 analytic comparisons (ΔPSI ≥ 5%, q-value ≤ 0.05)(Fig. 3a,b, Supp. Table 1–6).
Identifying AS events for each SF group that significantly differed from both disease and healthy controls revealed considerable overlap of AS patterns (Fig. 3b). High overlap is indicative of SF mutations or downmodulations that produce splicing patterns that are distinct from both disease control and healthy controls. The percentage of dysregulated AS events in the disease control comparisons that are also significant when compared to healthy control is indicated.
Mis-splicing patterns are consistent among diseases with common SF mutations
We then characterized the types of dysregulated splicing for each molecularly defined SF group. The results were concordant with other studies conducted on SF missense mutations in myeloid neoplasm patient samples, on engineered cell lines, and in murine models (Fig. 3c). Although the number of significant AS events varied between disease cohorts, trends such as increased exon exclusion in SRSF2P95 samples (8, 15, 20, 22, 25, 31, 37) and altered A3SS usage in SF3B1MT samples were consistent across diseases (Fig. 3c) (2, 16–19, 22, 26, 27, 32, 33, 35–37). U2AF1 mutations displayed trends of dysregulated exon inclusion and alternative 3’ splice site usage (1, 21–24, 28–30, 34, 37, 49), and U2AF1S34 was associated with a greater numbers of events than U2AF1Q157 (Fig. 3c). Differences in the number of significant AS events between disease cohorts with the same SF mutation may be partially related to sample size, underscoring the importance of procuring large cohorts for the identification of significantly dysregulated AS events (Supplemental Fig. 3c).
Expression levels of SFs have broad impact on cassette exon and intron splicing
To understand the impact of low expression of SFs on alternative splicing, we identified dysregulated AS events associated with differences in expression of DDX41, LUC7L2, PRPF8 and ZRSR2. The expression-based comparisons yielded far greater numbers of significant AS events than the SF mutation cohorts (Fig. 3d). Taken in conjunction with the unsupervised hierarchical clustering data, our results indicate that expression of SFs have a broad impact on AS in hematopoietic progenitor cells.
Notably, LUC7L2 and ZRSR2 groups showed similar patterns of intron mis-splicing, with the majority of introns being more frequently excluded (4, 37) (Supplemental Fig 3d). This trend was also observed in our SF3B1MT samples and has been highlighted recently (22). Additionally, a re-assessment of AS studies in SF3B1 models and patients revealed that exclusion of RI is commonly found in RNA-Seq data (18, 19, 26, 27, 37).
Recurrent Targets of Mis-Splicing
To identify the genes whose splicing is most frequently affected by SF mutations and low SF expression, we highlighted genes concordant among the same molecularly defined SF group, regardless of disease status (Extended Data Fig. 4a). Mis-spliced genes specific to a single disease could be involved in individual disease heterogeneity. Although no gene was ubiquitously mis-spliced among the 8 SF groups, the most frequently affected genes included ubiquitination factors (USP24, MARCH6, USP25, USP15, UBR4), splicing factors (RBM39, LUC7L2, SNRPA1, SMU1, LSM14A), transcription factors (BTAF1, CHD2, ZEB2) and cancer-related genes (RB1CC1, PHIP, SP100, SPAG9, PCM1, BIRC6, PTPRC) (Supplementary Fig. 4b).
We also identified the most frequently dysregulated AS events (i.e. significant in the majority of comparisons, green column Fig. 3a). The 50 most frequently affected AS events were located in genes for ubiquitination and deubiquitination factors (UBE2D3, UB32L3, USP15, RNF167, and MARCH6), mitochondrial factors (MRPL33, YME1L1, and UQCRC2), transcription factors (NCOR1, TFDP1, and BTAF1), DNA repair factors (TDP1 and SMC5), genes with a role in oncogenesis (OCIAD1, SMEK1, and SPAG9), and genes implicated in leukemia (ABI1 and IKZF1) (Fig. 4a). Of the 17,300 mis-spliced events, 74% were significant in at least 2 of the 60 comparisons shown in Figure 3a. Therefore, we have made the q-values, mean PSI values, and ΔPSI values of each significant AS event available in easily queriable tables (Supplemental Table 1a–e) to encourage mechanistic studies of dysregulated AS events in myeloid neoplasms.
Predicted impact of dysregulated AS on biological and clinical outcomes
We have provided an unprecedented resource in the identification of highly significant AS events driven by splicing factor mutations that are reproducible across multiple myeloid neoplasm subtypes. However, the question of whether or not the these mis-splicing events results in degradation by NMD or confers altered function remains, and understanding which mis-spliced transcripts are most likely to contribute to the disease phenotype is essential.
To this end, we designed a pipeline to infer the functional impact of AS dysregulation in silico. We identified hundreds of AS events that activate cryptic splice sites, shift the reading frame, and correlate with decreased transcript expression (Fig. 4b, Supplemental Table 4). We also identified AS events that are likely translated and encode functional protein-domains (Fig.4b, Supplemental Table 2). Finally, we analyzed associations between AS events and overall survival as well as and Hallmark pathway dysregulation (Fig. 4b,c, Supplemental Fig. 4c,d, Supplemental Table 3). Integration of these AS data, gene expression data, clinical variables and exon ontology annotations provided insights into the functional impact of the most recurrently dysregulated AS events (Fig. 4a) in myeloid neoplasms. For example, SRSF1 A3SS 4 introduced protein structure and a binding site, potentially altering the function of SRSF1. TRA2A exon 3b was positively correlated with TRA2A gene expression. Inclusion of TRA2A exon 3b and SRSF1 A3SS 4 were both inversely correlated with survival in AML and with expression of oxidative phosphorylation targets (Fig. 4b,c, Supplemental Table 2,3). These examples aside, we provide the functional assessment (all analyses in Fig. 4b) for each of the 17,300 significantly dysregulated events identified in our study (Supplemental Tables 2, 3a–e, 4).
Mis-spliced introns distinguish disease from healthy bone marrow
The differences between the AS patterns in myeloid neoplasms compared to healthy bone marrow are poorly understood, therefore we focused on characterizing the AS events that were significant when the SF groups were compared to healthy controls, as opposed to disease controls. The mis-splicing events that deviated most strongly from healthy bone marrow included both SF specific and pan-disease mis-splicing events (Fig 5a). We collected the AS events that most often distinguished myeloid malignancies from healthy bone marrow regardless of splicing factor mutation. Within this group, excluded RIs and A5SSs were overrepresented (Fig 5b). This set of introns displayed unusual features; the majority of these introns were poorly spliced in healthy bone marrow (mean PSI 40–100%), with increased exclusion across multiple SF and SF WT groups (Fig. 5c). The high PSIs of the introns identified in healthy controls were unexpected given the low proportion of introns with a mean PSI >10% (Supplemental Fig. 2c). The introns were also significantly shorter on average (2393 bp vs. 6190 bp) and very few intron inclusion levels were correlated with changes in transcript expression (Fig. 5d, Supplemental Fig. 5a,b). RI-containing transcripts were enriched in GO terms such as gene expression, RNA splicing and RNA transport (Fig. 5e).
The high inclusion levels in quiescent cells, lack of correlation with transcript stability, and shorter length suggest that we have identified a group of “detained introns.” Detention of introns is a known mechanism of translational control in quiescent cells, although the specific introns involved are likely to be tissue specific (50–55). Increased IR is essential for differentiation of early progenitor cells into myeloid lineage cells(52, 56, 57). Increased removal of specific retained introns is also observed in self-renewing cells as well as in breast cancer and SF3B1 mutant MDS (18, 19, 22, 26, 27, 37, 58). We observed this trend in multiple splicing factor groups (Fig 3c,d), but also across all myeloid neoplasm samples within our cohort. This is the first indication that detained introns are excluded in the majority of myeloid neoplasm progenitor cells and suggests that the failure to retain introns may be connected to the failure of differentiation in myeloid lineage cells.
Classification of rare mutations in SFs
Uncharacterized mutations outside of hotspot positions (Supplemental Fig. 1b) were not included in our SF groups, but it is possible that these newly identified putative somatic mutations in the SFs would have a similar impact on AS. Having established AS signatures for each SF molecularly-defined group, we used hierarchical clustering to identify uncharacterized missense mutations in the SFs that phenocopy the AS patterns (Fig. 6a, Supplemental Fig. 6a–h). Previously uncharacterized mutations seen in our cohort, including those within SF3B1; K700_V701insE, M784_K785delinsI, W658C and H662Y, cluster with the previously reported heat repeat mutations (Supplemental Fig. 6a). Mutations in SRSF2; F57Y and D73G clustered with P95 mutations, while P96L did not (Supplemental Fig. 6b). U2AF1S34 and U2AF1Q157 clustered separately and no other U2AF1 mutations clustered with S34(F,Y) (Supplemental Fig. 6 c,d). However, other U2AF1 mutations (C154S, Y158_E159dup and R156H) clustered with Q157(P,R) (Supplemental Fig. 6d). In contrast, M1f., M172L and Q157H did not cluster with either S34F or Q157(P,R). The analysis also revealed point mutations that may confer loss of function on LUC7L2 and ZRSR2. Patients with missense mutations in LUC7L2; R71H, splice site mutations, and alternate start sites (M1) clustered with low LUC7L2 expressers (Supplemental Fig. 6e). Patients with mutations in ZRSR2; G438_R442dup, C172Y, H330Y, Y271C, H330, and splice site mutations clustered with low ZRSR2 expressers (Supplemental Fig. 6f). These data contribute to our understanding of functional domains in SFs, and provide opportunities to personalize therapy based on common splicing signatures, rather than specific missense mutations.
Identification of neojunctions
The complex analysis performed also indicated that AS in myeloid neoplasms generates predictable novel coding sequences that could potentially be targeted for diagnostics or therapy. AS can generate novel protein junctions through gain or loss of coding RNA sequences or the introduction of frameshift alterations(59, 60). We classified myeloid disease-specific splicing events (DSSEs) as exon exclusion events that were observed in the disease cohorts but did not occur in the healthy controls. After filtering for reproducibility and testing for binding to class I MHC, we identified 925 DSSEs (Fig. 6b) (61, 62). Twenty DSSEs were identified (≥%5 exon exclusion) in the majority of patients in one or more SF mutation group (Fig. 6c). Several DSSEs were splicing-factor specific and reproducible between MDS and AML cohorts, e.g. SF3B1 (FMNL1, PILRB, FAM143A), ZRSR2 (EIF4G3, ZNF207), and SRSF2 (RASGRP2, CD2BP2). Others were found in 20–60% of MDS and AML patients regardless of SF mutational status (CPXM1, TPT1, IPO4). Neojunctions generated through AS can be translated into neoepitopes that have the potential to be targeted through immunotherapy(59, 60). Our study has identified neojunctions that are specific to SF mutations as well as neojunctions that are pan-disease.
In summary, we identified unique AS events based on SF mutations and SF expression as well as shared events between all patients, irrespective of mutations. Therefore, SF mutations and downmodulation exaggerate pathological splicing patterns, in addition to producing individual characteristics. Our data indicate that a collection of ordinarily retained introns are excluded in patients, potentially blocking differentiation and maintaining a myeloid precursor phenotype. Thus, the search for a discrete abnormality or singular event will not be successful. This highlights the continuum of disease; enhanced intron exclusion is observed in all patient samples and genetic aberrations in SFs exacerbate further intron exclusion. Although we no longer expect to find a singular AS event driving pathogenesis, diseased AS signatures provide multiple targets with the potential to be targeted by treatment(59, 60). Both SF-specific and pan-cancer novel AS events that arose in myeloid neoplasms were identified in our work. These events, combined with our classification of uncommon SF mutations, identify specific groups of myeloid neoplasm patients expressing novel coding sequence that can be used for diagnosis or potential targeted therapy.
Acknowledgements
This work was supported by U.S. NIH grants R01HL123904, R01HL132071 and R35HL135795 and Torsten Haferlach Leukämiediagnostik Stiftung. The authors wish to acknowledge the Vera and Joseph Dresner Foundation as a funding source and thank them for their contributions to this work. CEH was supported by NIH F31HL131140. We thank the staff of MLL for sample preparation and sequencing, RC Dietrich for helpful discussions and comments regarding the paper, DM Rotroff for assistance with clustering analysis, and T Radivoyevitch for advice on statistics.
T.H., C.H. and W.K. serve as the management board of the MLL Munich Leukemia Laboratory. N.N, S.T., S.H, M.M., W.W., and C.B. are employed by the MLL Munich Leukemia Laboratory. The MLL offers diagnostic services for leukaemias and lymphomas, including cytomorphology, cytochemistry, immunophenotyping, cytogenetics, FISH, and a broad spectrum of molecular assays. In addition, MLL runs several research studies based on a combination of methods for routine use and also including whole genome sequencing and whole transcriptome sequencing.
References
1.
2.
3.
4.
5.
6.
7.
8.
9.
10.
11.
12.
13.
14.
15.
16.
17.
18.
19.
20.
21.
22.
23.
24.
25.
26.
27.
28.
29.
30.
31.
32.
33.
34.
35.
36.
37.
38.
39.
40.
41.
42.
43.
44.
45.
46.
47.
48.
49.
50.
51.
52.
53.
54.
55.
56.
57.
58.
59.
60.
61.
Floating objects

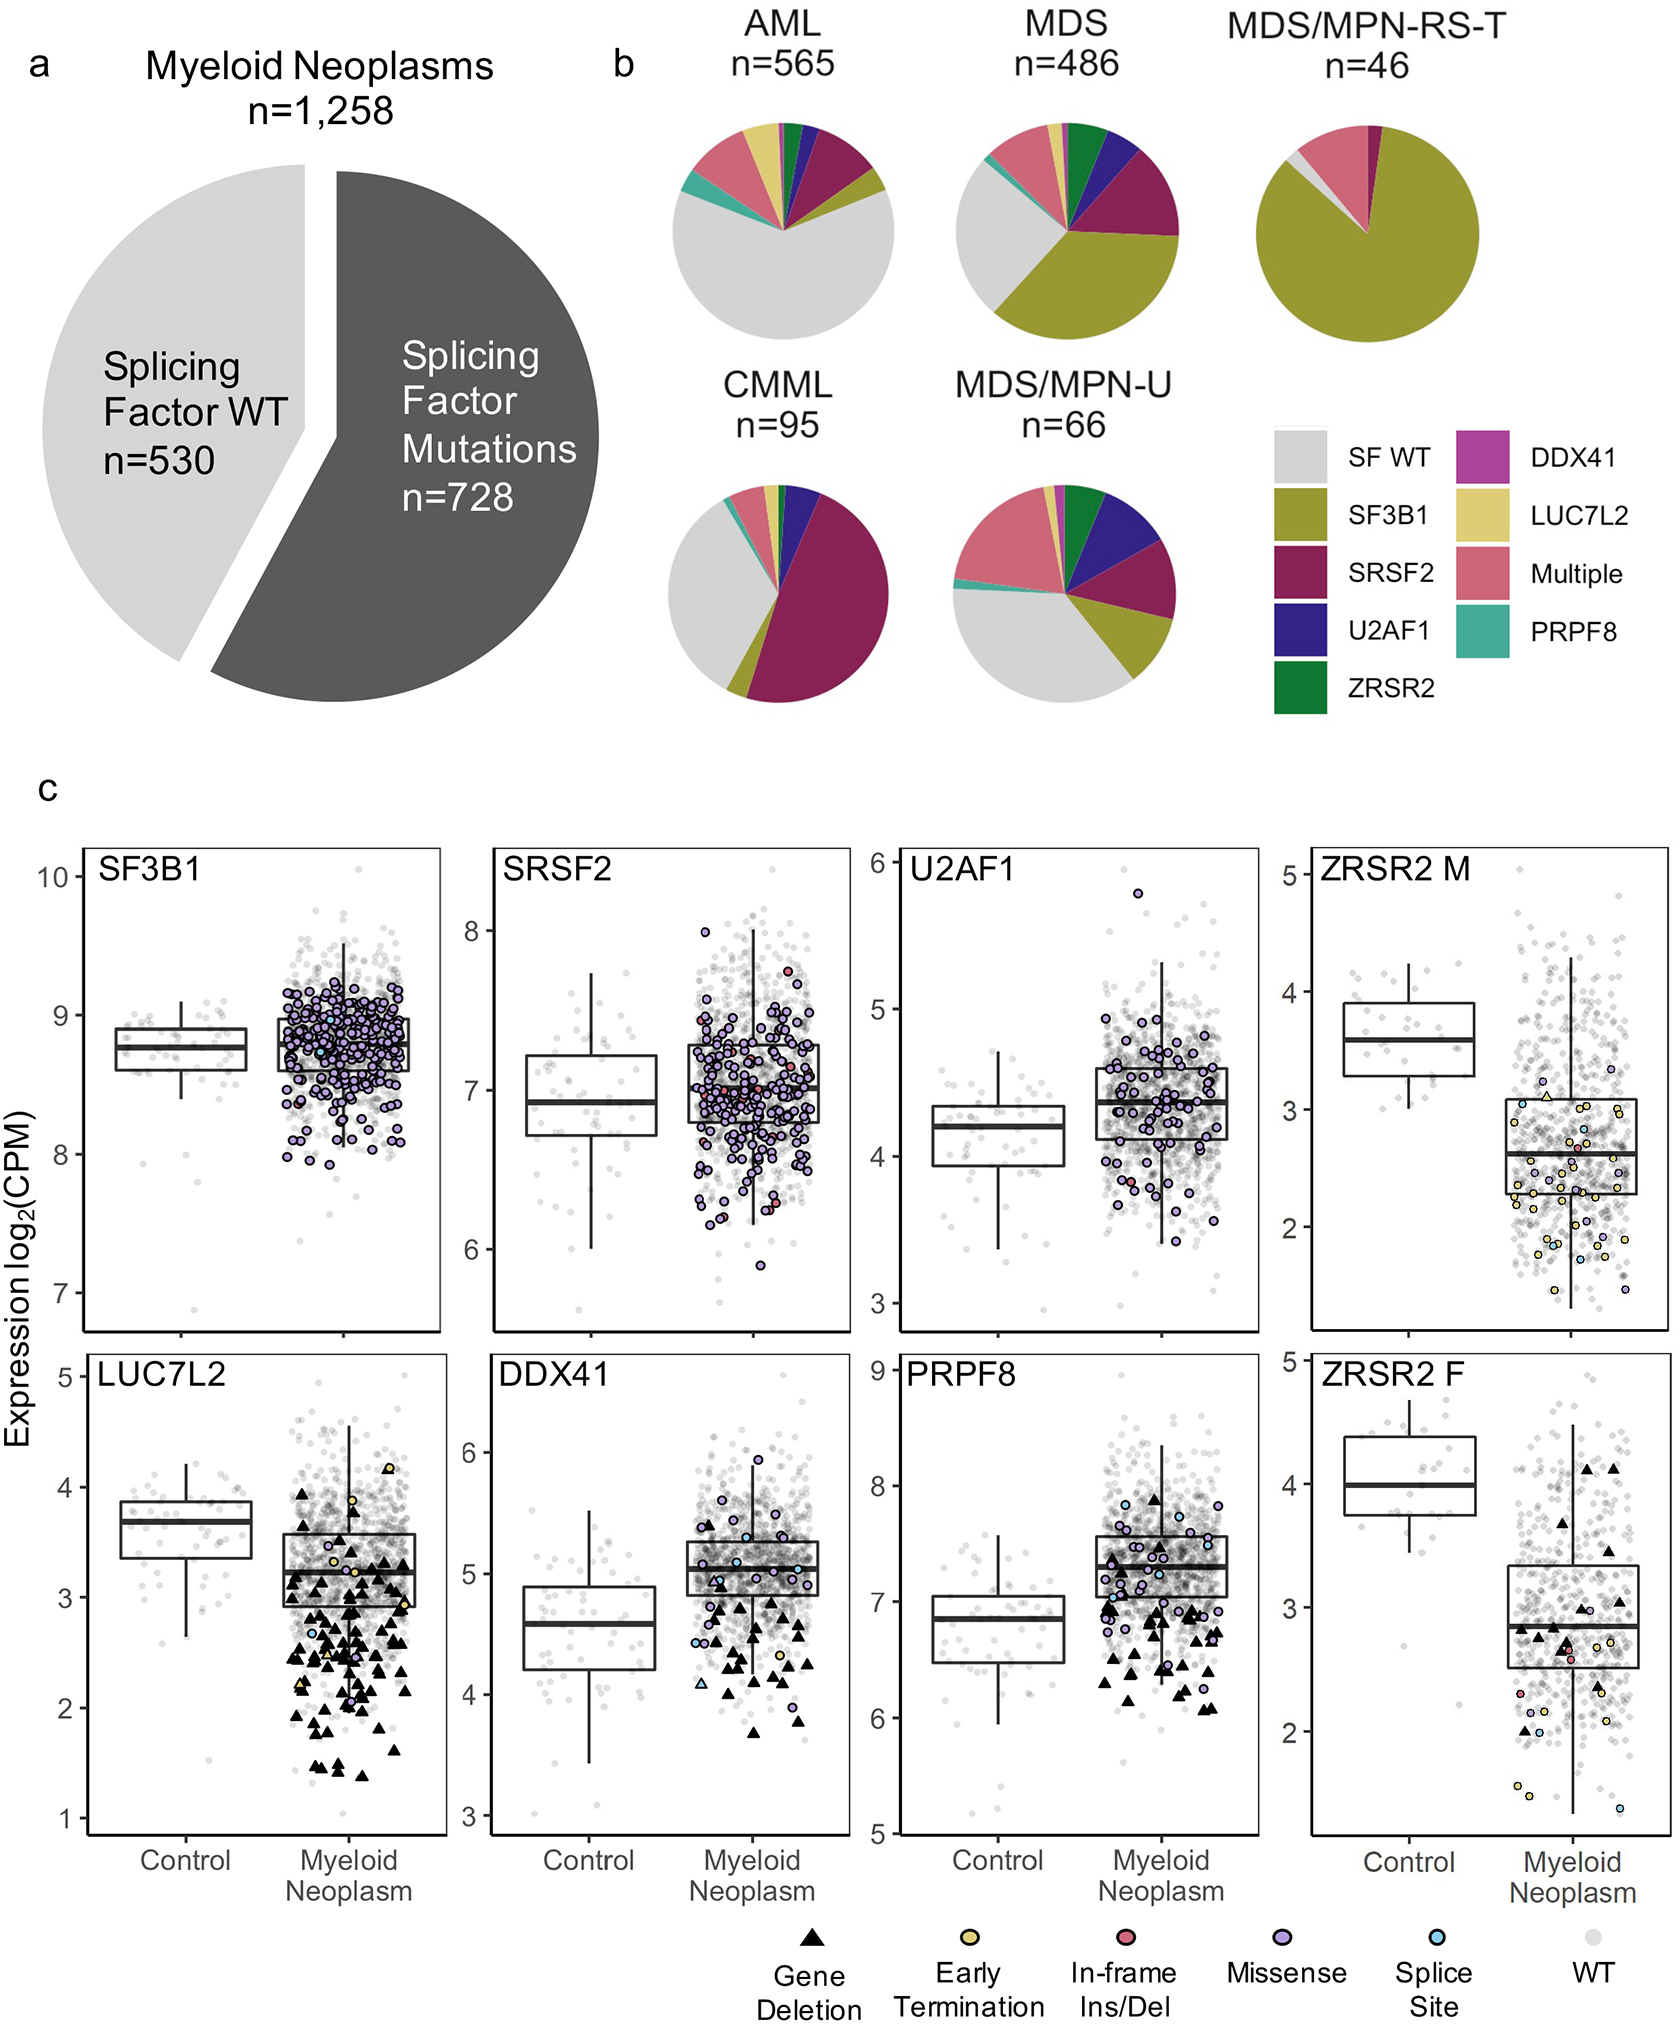
Overview of splicing factor (SF) mutations and expression levels in the cohorts.
(a) Percentage of patients harboring SF mutations. (b) Frequency of SF mutations in the cohort listed by disease from patients with one of five myeloid neoplasms (AML=213/565, MDS=365/486, CMML=63/95, MDS/MPN-U=42/66, MDS/MPN-RS-T=45/46). (c) mRNA expression in log2 counts per million reads (CPM) of SFs in healthy BM controls and in myeloid neoplasm patient samples, with and without mutations and/or chromosomal deletions. ZRSR2, an X-linked gene, is grouped by patient sex.
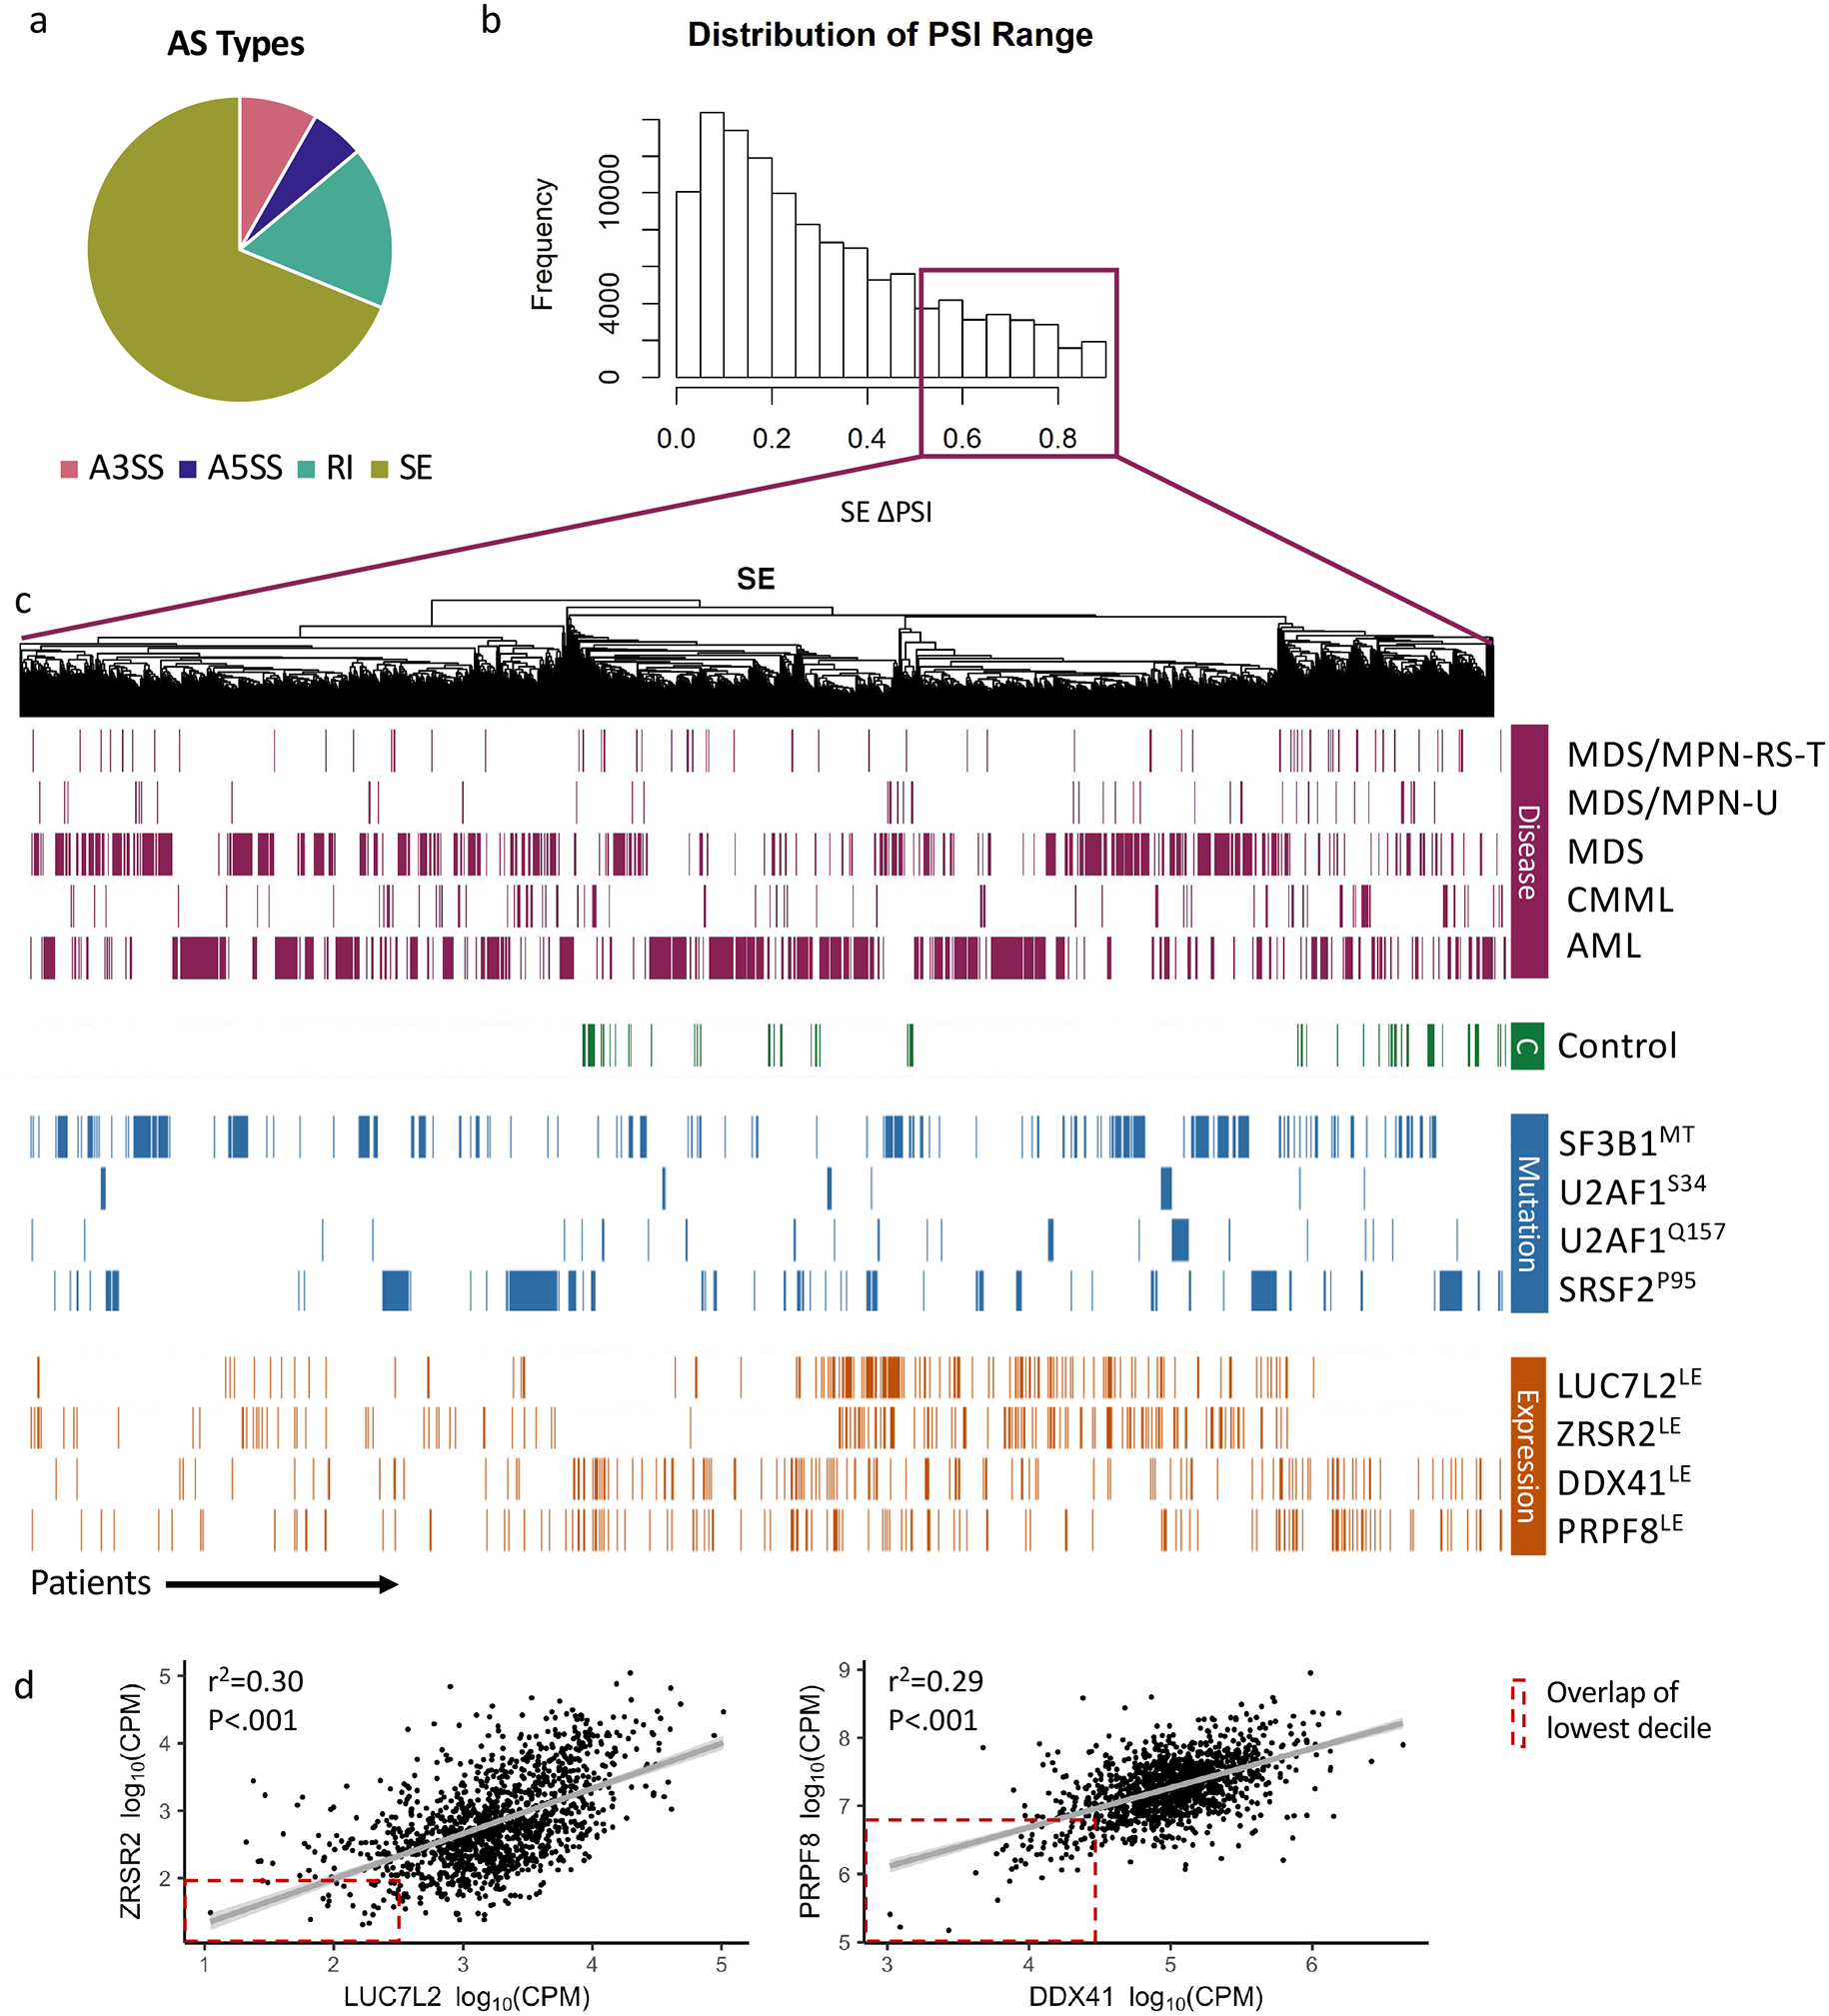
Overview of alternative splicing (AS) events observed in patient and control samples and quantified by rMATS. (a) Distribution of AS types across 170,006 AS events: alternatively spliced / skipped exons (SE), 68.8%; alternatively spliced introns / retained introns (RI), 17.2%; exons with alternative 5’ splice sites (A5SS), 5.7%; and exons with alternative 3’ splice sites (A3SS), 8.3%. (b) Distribution of the percent spliced in (PSI) Range observed across all samples. (c) Unsupervised hierarchical clustering of the 20,000 alternative spliced exons with the largest range. Samples are annotated by disease, splicing factor mutation (SF3B1, SRSF2, U2AF1) or splicing factor expression (DDX41, LUC7L2, PRPF8, ZRSR2). “LE” indicates that the sample is among the 10% lowest expressers (samples were ranked by Log2CPM) in the cohort. (d) Correlations of ZRSR2 expression with LUC7L2 expression and DDX41 expression with PRPF8 expression (r2 and p value generated by linear regression). Overlap of low expressers indicated with red box.
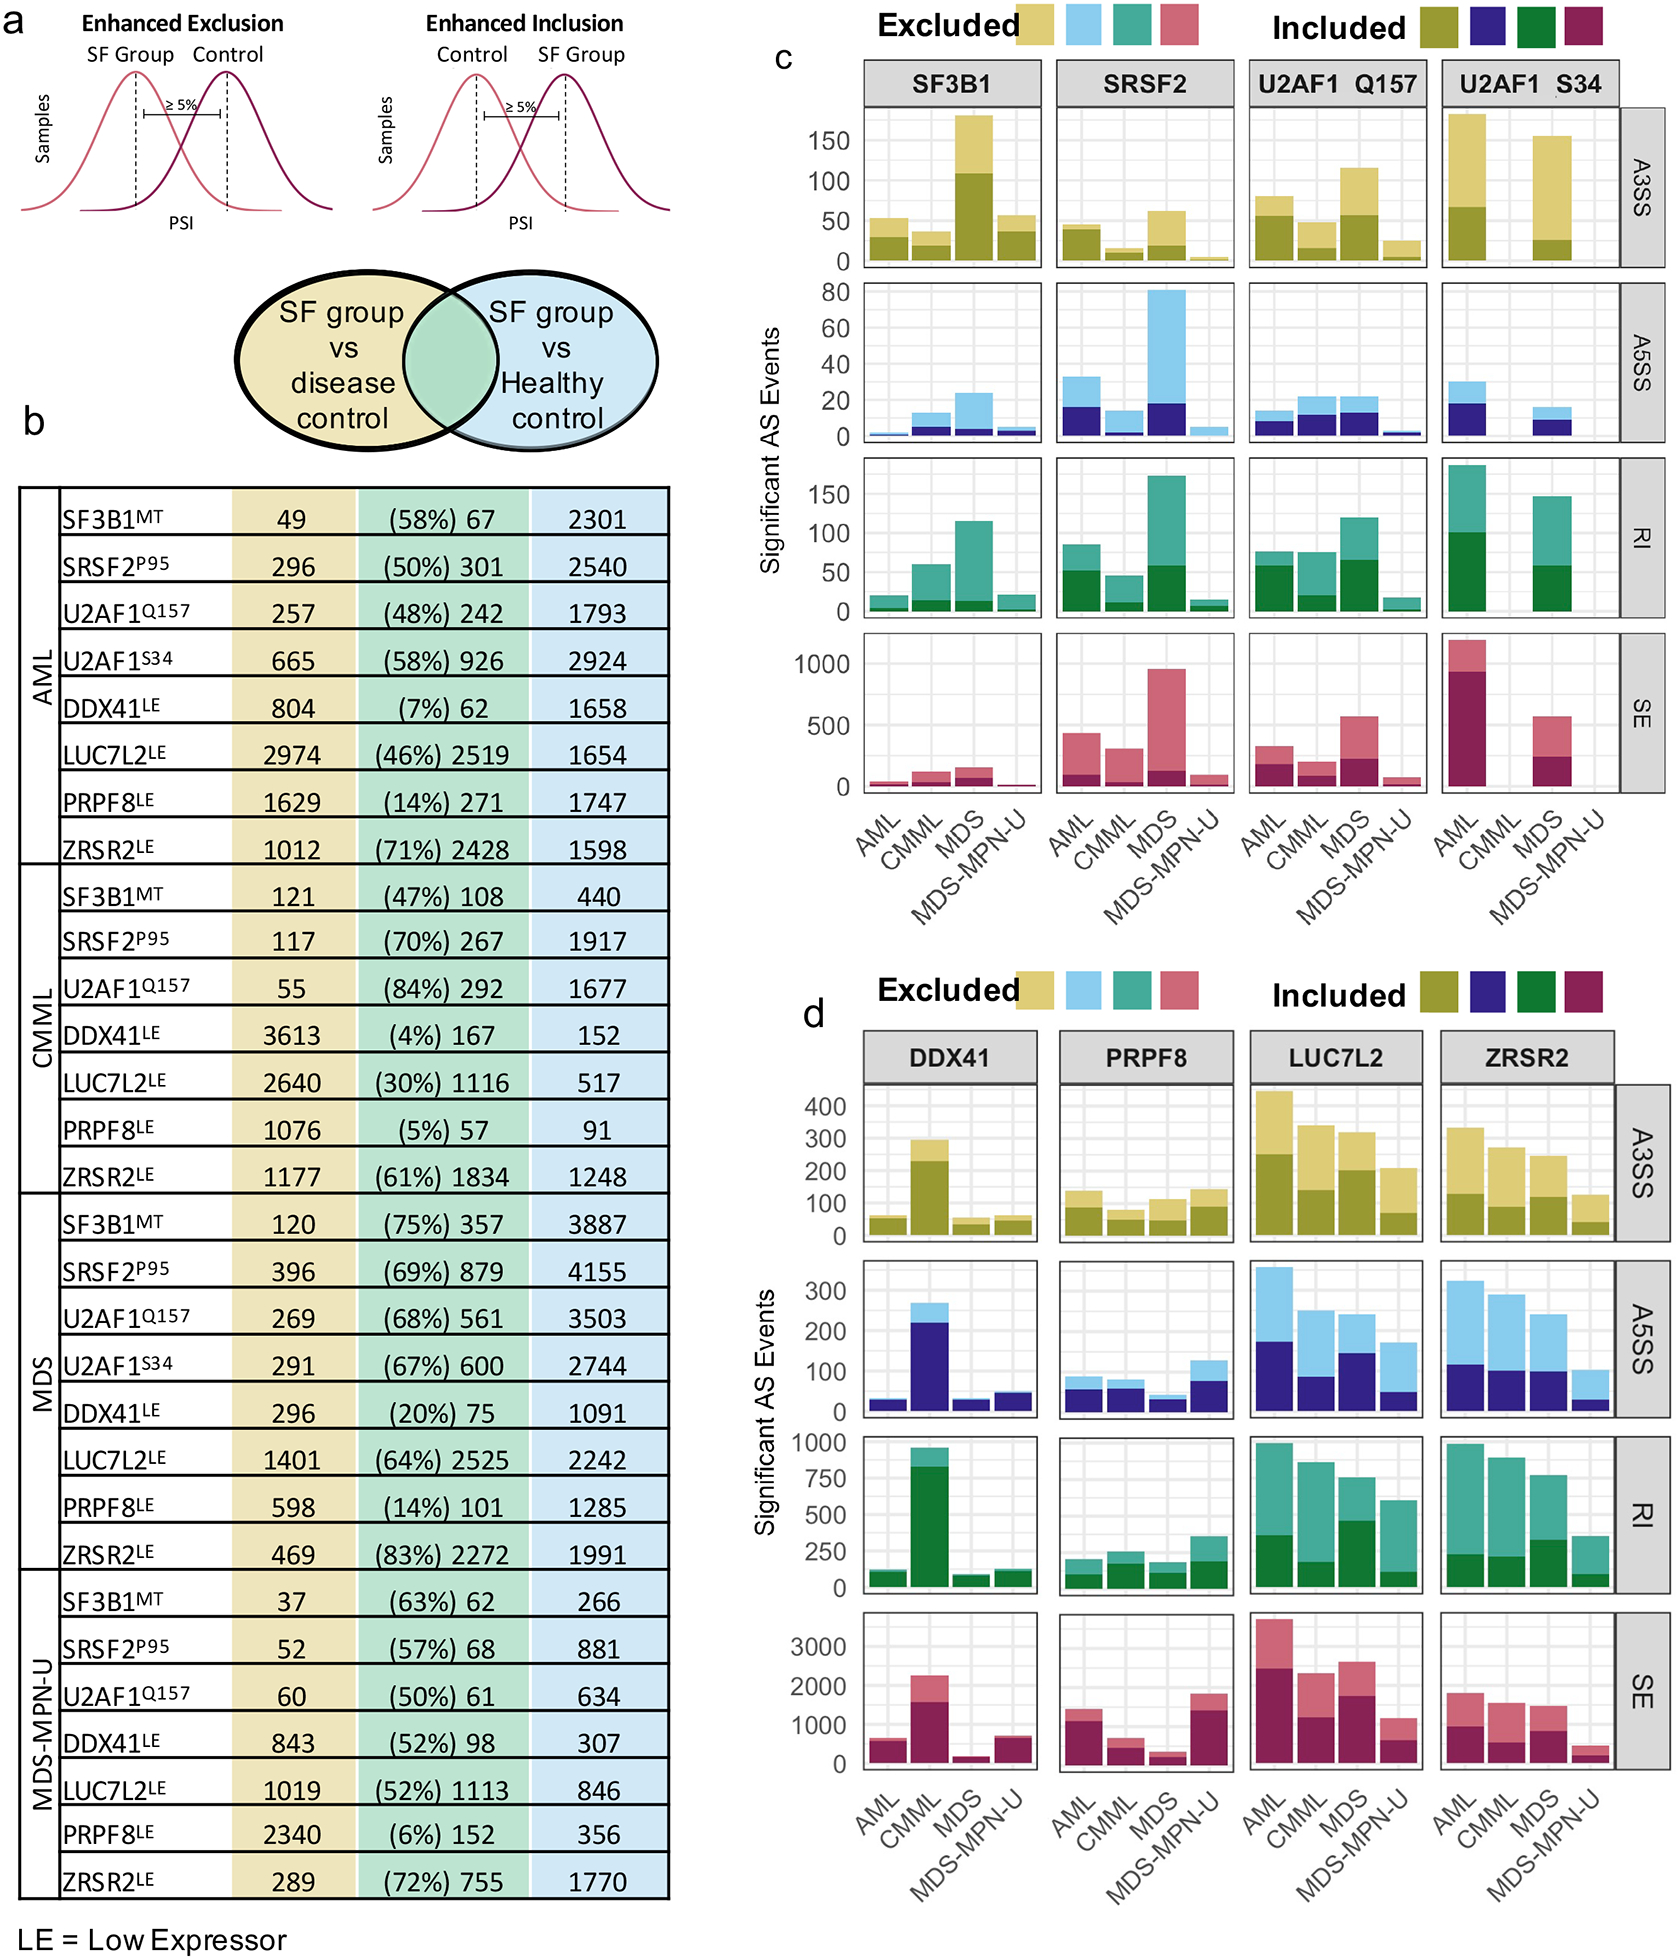
Distribution of dysregulated alternative splicing events by disease and SF mutation or expression.
(a) Schematic showing identification of mis-spliced AS events. (b) Overlap of dysregulated splicing events comparing splicing factor group to disease controls and healthy controls. The number of AS events commonly dysregulated are in green. Of all significant AS events in SF group vs disease control, the percentage of those that were also significant in SF group vs healthy control is displayed. (c) Number of mis-spliced (ΔPSI ≥ 5%, q-value ≤ 0.05) AS events in samples with SF mutations compared with disease controls. Cohorts are divided by disease and SF mutation status. Lighter color indicates enhanced exclusion of exon or intron; darker color indicates enhanced inclusion of exon or intron. (d) Number of mis-spliced AS events in samples with low expression (10% lowest of cohort) of DDX41, LUC7L2, PRPF8, or ZRSR2 compared to high expressers (10% highest in cohort), legend description as in figure 3c.
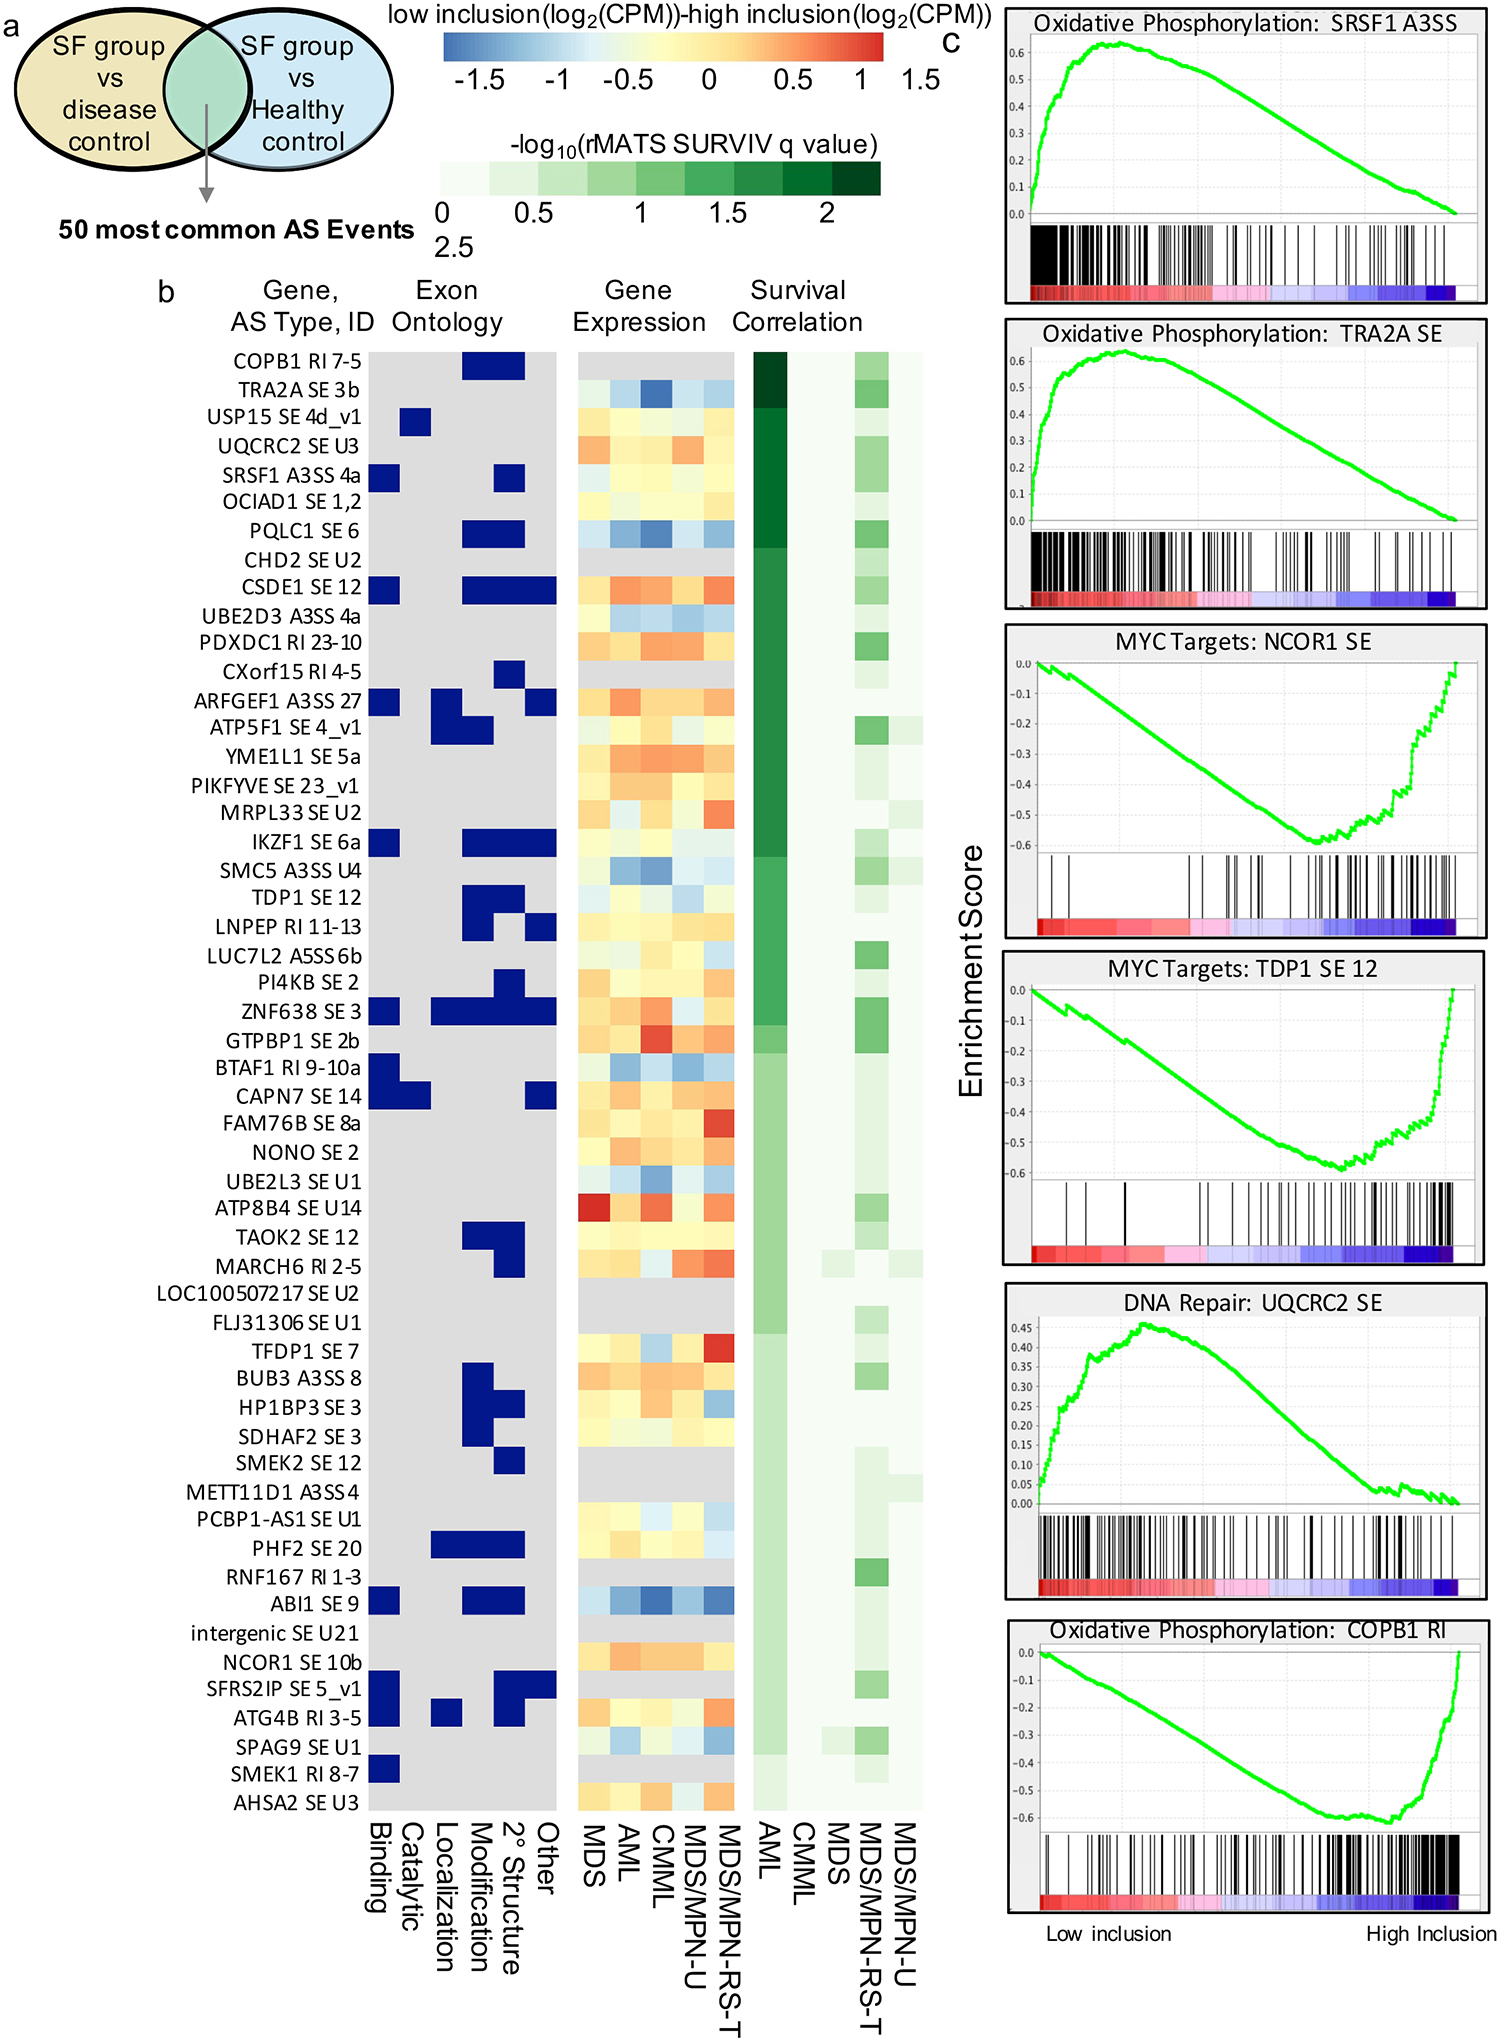
Predicted impact of AS on biological and clinical outcomes.
(a) Selection of most frequently dysregulated AS events from Figure 3c. (b) AS event IDs: Gene symbols, AS type, and custom exon identifier of the AS event. Exon Ontology: Binary chart showing the presence of exon ontology features in dysregulated exons. AS events were classified as containing structural elements, PTMs (post translational modifications), localization signatures, catalytic domains, or binding sites based on intersection with Exon Ontology DB annotation. Gene Expression: The cohorts were stratified by the inclusion of each AS event and plotted the expression level difference between the two groups, identifying many AS events whose inclusion correlated with changes in gene expression. Survival Correlation: Correlation of significant AS events and survival in each cohort using RMATS-SURVIV. Results are displayed as –log10 transformed q-values, indicating the false discovery rate (FDR). (c) MDS and AML cohorts were combined and stratified by AS event inclusion level. Pathway analysis revealed dysregulated expression of Hallmark Gene sets in low- versus high inclusion groups.
Enhanced exclusion of RIs in SF groups compared to healthy controls.
(a)Top 5 mis-spliced gene in each SF group compared to healthy bone marrow (significant in 4 diseases, largest median ΔPSI). (b) Distribution of AS types in 494 AS events found to be significant in >= 20 SF groups compared to healthy controls. (c) Mean PSI of each SF group for each excluded RI identified in Fig. 6A. (d) Length of all introns and RIs in (b) (T-test, unpaired, two-tailed, unequal variances, P<0.001); retained introns are shorter (2393 bp vs. 6190bp). (e) Most significant GO terms describing RIs in (b).
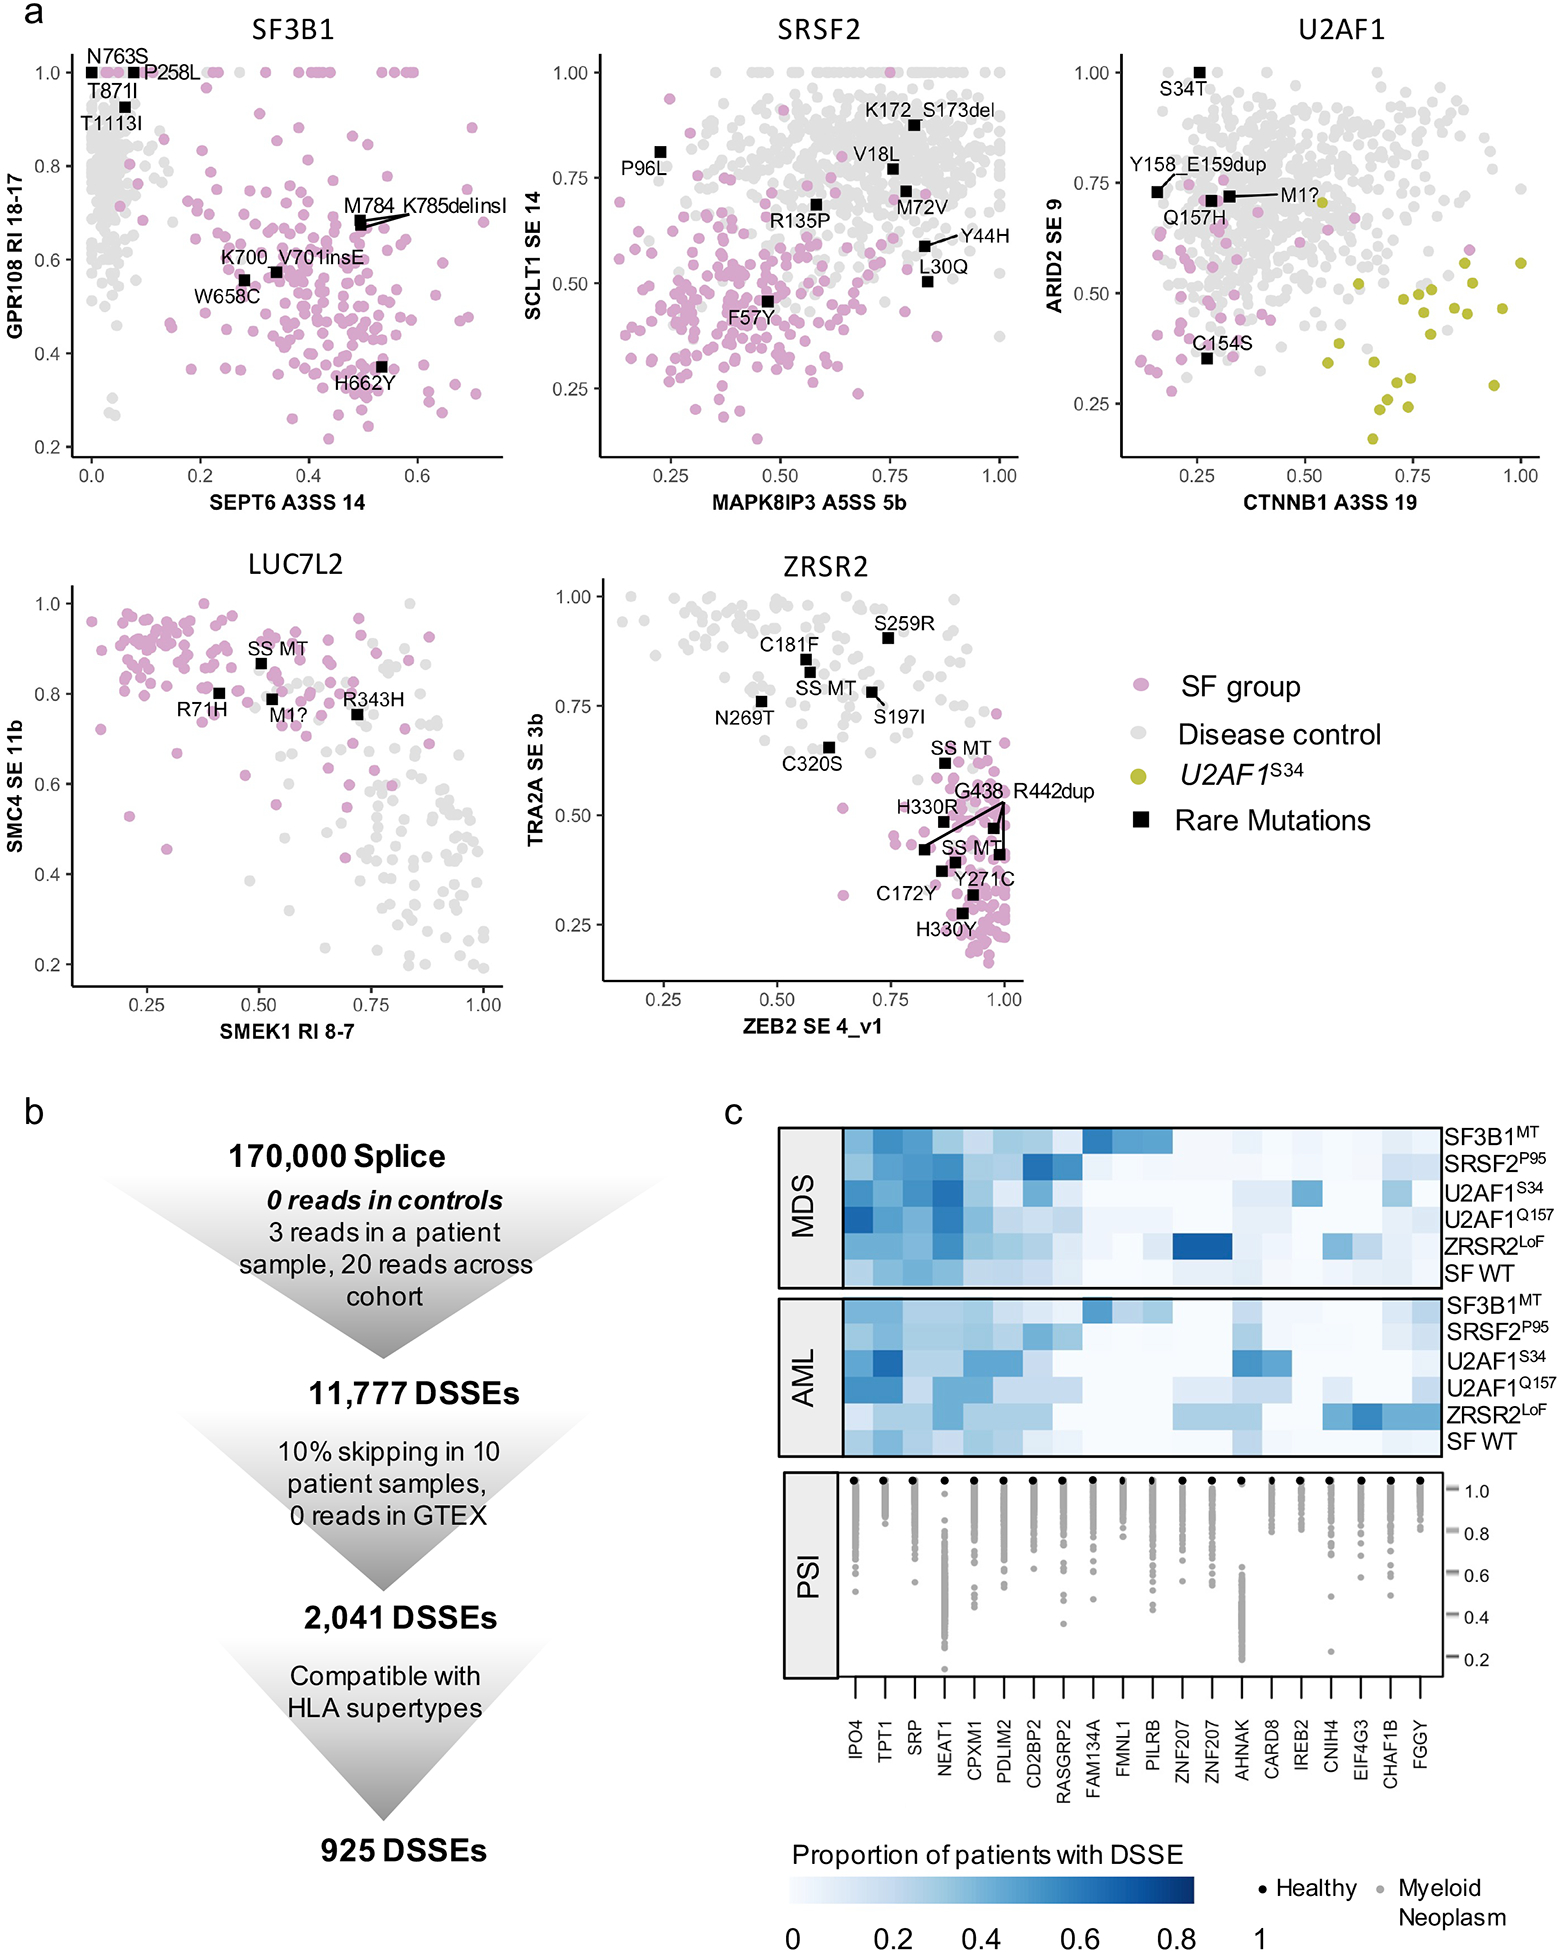
Characterization of rare somatic mutations in SFs and identification of neojunctions.
(a) Plot of PSIs for the two strongest AS events, found in at least 3 disease groups. Rare mutations that have not been recorded by the three databases (COSMIC, ClinVar, Cancer Hotspot) or have not been confirmed to be somatic in COSMIC or pathogenic in ClinVar are displayed as labeled rectangles. (b) Schematic of disease-specific splicing events (DSSE): identification and filtering to identify strong and reproducible DSSEs. (c) Disease specific splicing events in MDS and AML that are found in ≥50% patients in at least one SF group and never in healthy controls.