 Photoinduced
Adsorption and Oxidation of SO2 on Anatase TiO2(101)
Photoinduced
Adsorption and Oxidation of SO2 on Anatase TiO2(101)
Journal of the American Chemical Society


- Altmetric
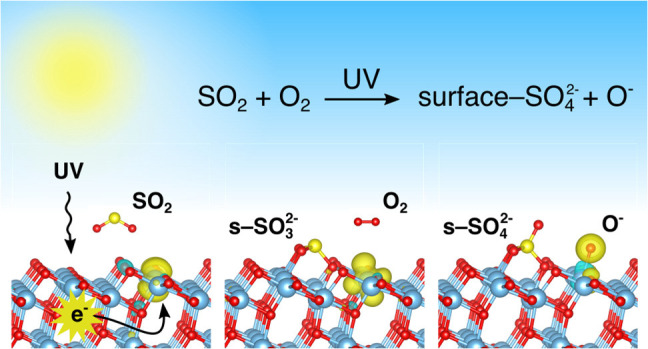
Adsorption of molecules is a fundamental step in all heterogeneous catalytic reactions. Nevertheless, the basic mechanism by which photon-mediated adsorption processes occur on solid surfaces is poorly understood, mainly because they involve excited catalyst states that complicate the analysis. Here we demonstrate a method by which density functional theory (DFT) can be used to quantify photoinduced adsorption processes on transition metal oxides and reveal the fundamental nature of these reactions. Specifically, the photoadsorption of SO2 on TiO2(101) has been investigated by using a combination of DFT and in situ diffuse reflectance infrared Fourier transform spectroscopy (DRIFTS). The combined experimental and theoretical approach gives a detailed description of the photocatalytic desulfurization process on TiO2, in which sulfate forms as a stable surface product that is known to poison the catalytic surface. This work identifies surface-SO42– as the sulfate species responsible for the surface poisoning and shows how this product can be obtained from a stepwise oxidation of SO2 on TiO2(101). Initially, the molecule binds to a lattice O2– ion through a photomediated adsorption process and forms surface sulfite, which is subsequently oxidized into surface-SO42– by transfer of a neutral oxygen from an adsorbed O2 molecule. The work further explains how the infrared spectra associated with this oxidation product change during interactions with water and surface hydroxyl groups, which can be used as fingerprints for the surface reactions. The approach outlined here can be generalized to other photo- and electrocatalytic transition metal oxide systems.
Introduction
Adsorption of molecules on surfaces is the fundamental step preluding all heterogeneous catalytic reactions. Such adsorption processes are well understood during thermally activated catalytic reactions,1−5 but corresponding insights into photoactivated adsorption processes are much less developed,1 albeit experimentally well established.6−8 The dominant view of photoadsorption on metal oxide photocatalysts is that molecular oxygen or surface cations capture photoexcited electrons, while holes are captured by hydroxyls from dissociated water molecules or surface oxygen atoms. This separation of excited charges is crucial for the overall photocatalytic efficiency, since recombination of electron–hole pairs otherwise occurs on a much faster time scale than the surface chemical reactions.9 On titania (TiO2), which is by far the most well-studied photocatalyst due to its large abundance and high stability, excited electrons are readily captured by O2 molecules, while the holes are localized at terminal OH– groups that form upon dissociative adsorption of H2O. This leads to the formation of O2– and OH•, which together have an oxidative potential exceeding 3 eV (290 kJ/mol). In particular, photoadsorption of O2 has attracted considerable interest, stemming back to works by Bickley et al.10,11 and Boonstra and Mutsaers,12 while H2O photoadsorption has gained attention recently because of the technologically important superwetting properties of UV irradiated TiO2 surfaces.13,14
Because photoadsorption plays an important role during photocatalytic reactions involving O2 and hydroxyls, it is reasonable that it should also be important in other photostimulated surface reactions. During artificial photosynthesis by CO2 reduction, adsorption of CO2 and subsequent formation of CO2– under photoillumination are considered to be crucial reaction steps.15 On TiO2(001), CO2 forms surface-CO32– by bonding to a lattice O2– ion,16,17 and it has been shown that an accumulation of CO32– species at the surface is associated with the deactivation of TiO2 during artificial photosynthesis, which typically occurs within a few hours.18 Similarly, the TiO2 surface becomes deactivated during NOx oxidation when surface-NO3– (Ti–O–NO2–) and/or adsorbed NO3–(ads) is formed.19−21 During photocatalytic oxidation of SO2, 98% of the reacted SO2 molecules are converted into strongly bound sulfate species that deactivate the surface completely in <30 min, such that the surface must be regenerated either by heating above 400 °C or by dissolving the sulfate ions in aqueous solutions.22 The latter approach is the simplest and most effective (provided that the pH is kept neutral), although sulfur poisoning still remains a large issue during oxidative desulfurization on TiO2.22,23 Several reaction mechanisms have been suggested to explain the transformation of SO2 into sulfate on TiO2,24−27 including formation of surface-SO42– through interaction with lattice oxygen and formation of SO42–(ads) by reactions with surface hydroxyls. It has also been suggested that oxygen vacancies are the main reactive adsorption sites,28 although this assertion was shown to be incorrect in our previous study.29 In previous studies we have shown that SO2 does not adsorb in the absence of UV illumination on crystalline and stoichiometric TiO2 at room temperature, employing identical particles as those used in this work.29,30 These conclusions are qualitatively supported by the work of Baltrusaitis et al.,24 showing much larger adsorption capacity on small 4 nm TiO2 nanoparticles compared to 32 nm nanocrystals. Therefore, SO2 adsorption on anatase TiO2 provides a good example of how excited-state chemistries facilitate molecule adsorption.
In this work, we simulate the photocatalytic formation of surface-SO42– on TiO2(101) by localizing negative charge around the SO2 adsorbate. This generally describes the situation during interband absorption in strongly correlated metal oxides, where excited electrons usually localize on surface metal cations. The localization of charge on Ti in TiO2 enables the formation of a strong covalent bond between sulfur and lattice O2–, such that a surface-SO32– adsorbate is formed. This acts as an intermediate during formation surface-SO42– by a subsequent oxidation involving an adsorbed oxygen molecule. This photoadsorption mechanism can be understood as a concerted activation of lattice oxygen and neighboring titanium, which should be generally valid for other adsorbate systems, such as H2O, CO2, NO2, and so on, as well as other transition d- or f-metal oxides. It is thus also relevant in studies of geochemical reactions involving mineral dust particles.31−33 Importantly, our results present a simple mechanism by which photoadsorption processes can be simulated and quantified by using density functional theory (DFT). To add further support to these findings, dedicated experiments have been performed by using in situ diffuse reflectance infrared Fourier transform spectroscopy (DRIFTS), and these combined methods have been used to study both the sulfate formation on TiO2 and the subsequent interaction of the sulfated surface with water and surface hydroxyls.
Simulations
All simulations have been performed by using the Vienna ab initio simulation package (VASP 5.4.4) and density functional theory (DFT). A generalized gradient approximation (GGA) of the local density functional has been employed by using the functional proposed by Perdew et al.34 (PBE), implemented together with a Hubbard-like U correction term (U = 3.5 eV) to account for the on-site Coulombic interactions of the titanium d electrons, as proposed by Dudarev et al.35 The DFT+U method is a computationally affordable alternative to hybrid functionals, and it has been recommended particularly for use within catalytic metal oxide systems.36 The particular U value used in this work has been suggested by Selloni et al.37 based on a linear response analysis using a defective anatase TiO2(101) slab. To localize added electrons at specific Ti sites, the titanium atoms were slightly displaced prior to the ionic relaxation, such that local potential energy minima were obtained after relaxation on Ti4+ ions, which thereby were reduced to Ti3+. The assignment of the Ti3+ ions was made based on their characteristic magnetization (close to unity) and by inspecting the spin-density charge distribution. The titanium, oxygen, and sulfur atoms were treated by using 4, 6, and 6 valence electrons, respectively, and pseudopotentials have been generated by using the projected augmented wave (PAW) method to account for the valence–core interactions, as suggested by Blöchl et al.38 A plane wave basis set with a kinetic energy cutoff of 546 eV has been used to model the electronic wave functions, and all calculations have been performed at the Γ-point only inside the Brillouin zone.
The anatase TiO2(101) surface was modeled by using a total of 192 atoms in a slab consisting of 64 TiO2 units, building a (2 × 3) supercell with four stoichiometric TiO2 layers. The slabs were separated by a vacuum gap of more than 15 Å. Ionic relaxations were performed until all forces were <0.01 eV/Å by using a conjugant gradient algorithm. Vibrational frequencies were calculated by using the finite differences method implemented in VASP, that is, by displacing a selected number of atoms in the direction of each Cartesian coordinate to determine the Hessian matrix (step size 0.015 Å). Only atoms that were part of the adsorbate and the surface atoms coordinating with the adsorbate were allowed to move during this displacement. The calculated frequencies have been shifted by 0.08ν – 22.159, where ν is the wavenumber. This relation was obtained by plotting the difference between calculated frequencies of molecular SO2 and the experimental gas phase frequencies as a function of the wavenumber.
Experiment
In situ diffuse reflectance infrared Fourier transform spectroscopy (DRIFTS) measurements have been performed to monitor the photo-oxidation of SO2 on anatase TiO2 nanoparticles and to study the effect of a subsequent exposure to H2O. Measurements were performed on a vacuum-pumped FTIR spectrometer (Vertex 80v, Bruker Optik GmbH, Ettlingen, Germany) equipped with a custom modified Praying Mantis high-temperature reaction chamber (HVC-DRM-5, Harrick Inc., USA), which enabled gas flow through the powder sample bed and simultaneous IR and UV illumination of the sample during measurements. The gas flow was controlled by using mass flow controllers (Bronkhorst High-Tech B.V., Netherlands), and the sample was illuminated with a 365 nm UV LED light source (FC5-LED, Prizmatrix). The infrared light was detected by using a narrow-band HgCdTe detector, cooled with liquid nitrogen. All reported spectra were acquired from an average of 121 scans and measured with a spectral resolution of 4 cm–1.
The sample was a commercial anatase TiO2 powder (Hombikat UV100, Sachtleben Chemie GmbH, Duisburg, Germany) with an average crystal size of 9 ± 0.3 nm, as determined from X-ray diffraction (XRD) using the Scherrer equation. XRD measurements were performed on a Bruker D8 Advance diffractometer, operated with a Cu Kα X-ray source (λ = 1.5418 Å). The diffractogram is presented in the Supporting Information.
Prior to each DRIFTS measurement, the sample was heated in synthetic air (Air Liquid, 99.999%) at 400 °C for 15 min to remove impurities from the surface. A background spectrum was then measured at 200 °C and used for all subsequent measurements. The first DRIFTS spectrum was acquired after exposure to SO2 gas (Air Liquid, 99.98%) at 200 °C by using a mixture of 5% SO2 and 95% synthetic air, and the sample was subsequently illuminated with UV light during continuous DRIFTS measurements performed at 1 min intervals. The total gas flow rate was 100 mL/min, and the intensity of the UV light was ∼15 mW/cm2, as measured with a thermopile detector (PM160T, Thorlabs Inc.). Additional spectra were acquired after subsequently exposing the sample to H2O and/or changing the sample temperature. We added 1.5% H2O to the gas flow by passing synthetic air through a liquid water reservoir (18 MΩ·cm at 25 °C), kept at a fixed temperature of 12 °C.
Results and Discussion
Diffuse Reflectance Infrared Fourier Transform Spectroscopy
In situ DRIFT spectra obtained during photoadsorption and photo-oxidation of SO2 on anatase TiO2 are shown in Figure 1a. The inset figure shows how the intensity at 1305 cm–1 increases during UV illumination, which clearly illustrates that this is a photoinduced reaction. These data can be fitted to a pseudo-first-order reaction kinetics model, showing that the rate-determining step is of first order under these reaction conditions, where the reactant concentration of SO2 and O2 can be assumed to be constant (quasi-steady state). The formal quantum efficiency [rate of reacted molecules/rate of incident photons] was estimated to 0.14% based on the rate determined from the mode-resolved kinetic analysis. Figure 1b shows how the spectrum obtained after photo-oxidation changes upon changing the substrate temperatures and/or adding H2O to the gas flow. The two negative peaks measured at 3725 and 3680 cm–1 are associated with the loss of surface hydroxyl groups during adsorption, and the peaks situated at 1377, 1305, and 1200–1150 cm–1 are related to the photo-oxidized species.29 Surface hydroxyl groups are always expected to some extent on TiO2, especially in experiments conducted at atmospheric pressures, since TiO2 is hygroscopic and water can adsorb dissociatively at surface defect sites and facets such as {001}. The negative bands at 3725 and 3680 cm–1 indicate to what extent hydroxyls have been replaced or otherwise overshadowed by the addition of new adsorbates. As the temperature is increased from 200 to 500 °C, the spectral features associated with photo-oxidized SO2 are sharpened and remain strong, indicating that the reaction products are strongly bound to the surface. When the temperature is subsequently cooled back to 200 °C, the spectrum remains largely the same. There is a broad negative absorbance band in the region between 2500 and 3600 cm–1, which indicates that water has desorbed from the surface during heating to 500 °C, as also indicated by the negative absorbance band measured at ∼1620 cm–1. When water is reintroduced by adding H2O to the flow of synthetic air, positive absorbance bands develop at 3500 and 1620 cm–1 due to the readsorption of water, and bands in the region 1100–1400 cm–1 are once again broadened and appear red-shifted with respect to the initial spectrum. With water still present in the gas flow, lowering the temperature to 25 °C increases the amount of adsorbed water (2500–3600 cm–1) and results in the formation of a broad featureless peak centered around 1260 cm–1. By subsequently increasing the temperature to 200 °C, the characteristic features associated with photo-oxidized SO2 appear once again, showing that water has the effect of both broadening the peaks and shifting the frequencies to lower wavenumbers.

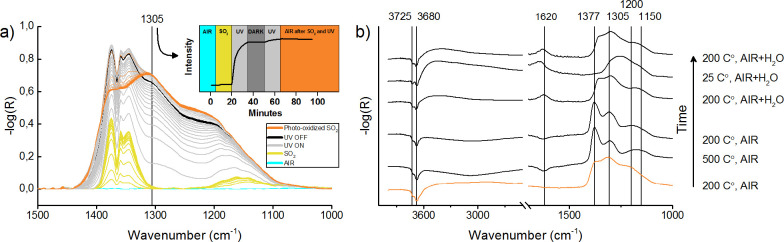
DRIFT spectra obtained (a) during photoadsorption and photo-oxidation of SO2 and (b) after SO2 photo-oxidation on anatase TiO2 nanoparticles. The bottom spectrum in (b), color-coded in orange to match the last spectra in (a), was acquired directly after photo-oxidation, and the spectra above, shifted along the ordinate axis for clarity, were measured after subsequently changing the sample temperature and/or adding H2O to the gas flow as indicated in the figure. The inset in (a) shows the measured intensity of the 1305 cm–1 band due to double-coordinated surface-SO42– as a function of time.
Previously there have been several reaction pathways suggested to explain the stepwise oxidation of SO2 into sulfite and subsequently sulfate on TiO2.24−27 Generally, these can be divided into two main reaction routes: one leading to the formation of “molecularly” adsorbed SO42–(ads) by reactions 1 and 3 and one leading to the formation of surface-SO42–, involving lattice oxygen by means of reactions 2 and 4, viz.


Photoadsorption of SO2
Figure 2 and Table 1 show the results of DFT calculations for surface-SO32– on TiO2(101) in different surface surroundings. From Table 1 it is also evident that surface-SO32– can be stabilized by the localization of negative charge at the adjacent Ti site (labeled Ti(1) in Figure 2b), whereby reduction of Ti4+ to Ti3+ lowers the adsorption energy by 55%. This situation can be realized by interband absorption, whereby electrons are transferred primarily from O 2p derived states in the valence band to Ti 3d states in the conduction band, such that excited electrons are localized at Ti sites at the surface. Figure 2a illustrates the adsorbate configuration resulting from adding extra charge on the Ti(1) ion, and Figure 2c–e shows the associated structural modifications of the lattice and adsorbate. Similar calculations have also been performed where hydrogen atoms were placed at neighboring oxygen sites to stimulate a transfer of electrons to the adjacent Ti ions, which are then reduced to Ti3+ (presented in the Supporting Information). The results from these calculations are summarized in Figure 2g, which shows a plot of the Ti(1)–O and S–O bond lengths (labels indicated in Figure 2b) as they shift due to the increasing degree of charge localization around the Ti(1) ion. The reason for these changes is the lowering of the cationic charge, which weakens the ionic bond strength and thereby strengthens the covalent bond between S and O. The calculated adsorption energy of the charged surface differs by <1.5% relative to the value obtained from a neutral surface, where hydrogen was used as electron donor (cf. Figures S2e and S2f). Figure 2g also illustrates how the bond lengths are changing due to the presence of a subsurface oxygen vacancy (VO). As shown in Figure 2f, the vacancy donates electrons to the Ti(1) ion, which results in an increase of the Ti(1)–O bond length, from 2.16 to 2.25 Å, but it also causes the S–O bond length to increase. This is because the sulfur atom, which has an oxidation state of +4, is repelled from the Ti4+ ion situated underneath the sulfur, which has moved upward due to the effective repulsion from the VO. This finding is important, since it suggests, quite generally, that subsurface oxygen vacancies can have a destabilizing effect on adsorbates. Surface oxygen vacancies are generally considered very reactive on metal oxides, but in the anatase TiO2 crystal structure they are significantly more stable at subsurface or bulk sites.40−43 Previous studies of reduced anatase TiO2 nanoparticles showed that subsurface oxygen vacancies enable SO2 adsorption in the absence of UV illumination but that the same defects do not promote photoinduced adsorption, as on the defect-free surface.29
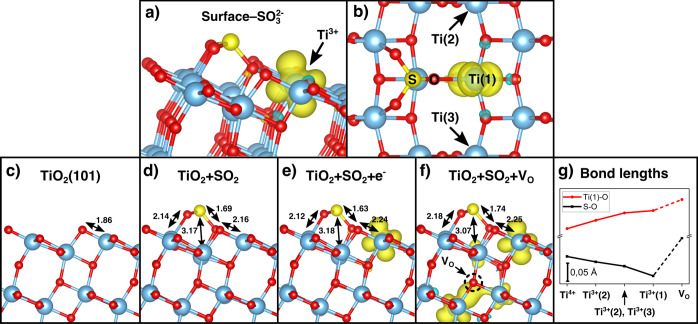
(a) Illustration of the surface-SO32– adsorbate structure with an additional electron localized at the neighboring Ti site (spin-polarized charge density plotted in yellow). (b) Top view of the surface-SO32– structure, shown together with a notation scheme for surface and molecular atoms. (c) Side view of TiO2(101), (d) TiO2(101) with SO2 adsorbed in the surface-SO32– configuration, (e) TiO2(101) with an adsorbed SO2 and an additional electron localized at the neighboring Ti site, and (f) TiO2(101) with surface-SO32– and a subsurface oxygen vacancy (VO). Bond distances are given in units of angstroms. (g) Plot of Ti(1)–O and S–O bond lengths as a function of increased degree of charge localization around the Ti(1) ion (see the Supporting Information; notations “(1)” and “(2)” as in (b)).

| adsorbate | coordination | on surface | Eads (eV) | ν1 (cm–1) | ν2(1) (cm–1) | ν2(2) (cm–1) |
|---|---|---|---|---|---|---|
| s-SO32– | double | –0.867 | 612 | 988 | 955 | |
| s-SO32– | double | Ti3+(1) | –1.34 | |||
| s-SO32– | double | VO | –0.693 | |||
| s-SO42– | double | –1.60 | 967 | 1358 | 1015 | |
| s-SO42– | double | Ti3+(1) | –2.23 | |||
| s-SO42– | double | VO | –1.44 | |||
| s-SO42– | double | OHterm–/OHbridge– | –1.99/–1.67 | 972/958 | 1310/1352 | 1030/1038 |
| s-SO42– | double | H2O | –1.92 | 984 | 1265 | 1061 |
| s-SO42– | single | –1.26 | 895 | 1210 | 1399 | |
| s-SO42– | single | OHterm–/OHbridge– | –1.52/–1.64 | 921/933 | 1188/1158 | 1369/1368 |
| s-SO42– | single | 2H2O | –1.90 | 980 | 1174 | 1267 |
| exptl | 1305, 1150–1200 | 1377 |
Oxidation of Photoadsorbed SO2 into Surface-Sulfate
Now we turn to the transformation of surface-SO32– to surface-SO42–. Figure 3a shows a potential energy diagram illustrating the transfer of an oxygen atom from adsorbed O2– to surface-SO32–, leading to the formation surface-SO42–. This sulfate species is significantly more stable than the corresponding sulfite, with an absorption energy of −1.60 eV relative to a free SO3 molecule. The adsorbate is further stabilized by localization of negative charge at the neighboring Ti(1) site (see Table 1) but destabilized by a subsurface oxygen vacancy, as was the case with surface-SO32–. In Figure 3a, an O2 molecule is placed above Ti(1) together with an additional electron, leading to the formation of a superoxide species (O2–). This is expected to occur under UV illumination, since oxygen molecules are known to be adsorbed at Ti surface sites and accept electrons from the conduction band. The starting configuration in Figure 3a is also reasonable considering that this is where the oxygen is brought closest to the sulfur atom in surface-SO32–. As the O2– gradually moves closer to the surface-SO32–, an oxidation reaction takes place by the transfer of a neutral oxygen atom to sulfur, leading to the formation of surface-SO42– and O–(ads). This process is strongly exothermic, with a calculated formation enthalpy of −1.20 eV. To estimate the kinetic energy barrier associated with the oxygen transfer, the energies of the intermediate structures were calculated by locking the position of the sulfur atom and allowing the oxygen atom to move only in the directions defined by the surface normal and the bridging oxygen row (i.e., not directly toward the sulfur) during the ionic relaxation. It is likely that there exist several reaction pathways, but the one depicted in Figure 3a is representative and serves well to give an illustrative example. The Gibbs free energy during an Eley–Rideal reaction, in which a neutral oxygen transfers directly from a gas phase O2 molecule, is even lower (ΔG = −1.52 eV) than the corresponding surface reaction (ΔG = −1.20 eV) and could therefore also be a feasible reaction pathway. The surface-SO32– adsorbate is thus expected to be readily oxidized in the presence of oxygen.
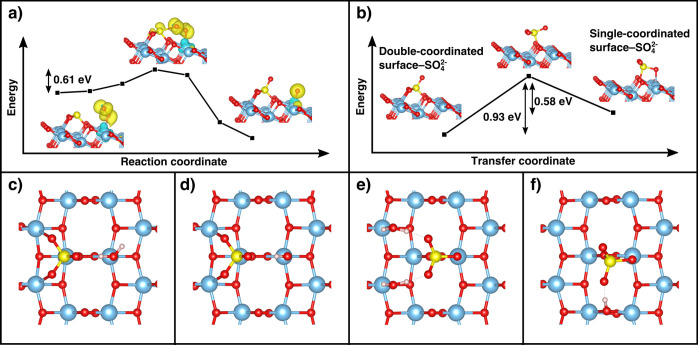
(a) Reaction coordinate diagram illustrating the kinetic energy barrier associated with the transfer of oxygen from a superoxide (O2–) species to the SO2 molecule, adsorbed in the surface-SO32– configuration. The atomic configurations and spin-polarized charge density (yellow isosurfaces) are shown as inset figures. (b) Kinetic energy barrier associated with the transition from double-coordinated to single-coordinated surface-SO42–, as obtained from a nudge elastic band calculation using three images and a spring constant of 5 eV/Å2. (c) Top view of the double-coordinated surface-SO42– adsorbate, bonding to an H2O molecule and (d) to a terminal OH– group. (e) Single-coordinated surface-SO42– bonding to two H2O molecules and (f) to a bridging OH–.
During formation of surface-SO32–, the SO2 molecule can also bind with a single oxygen to the Ti(1) ion, which, by subsequent oxidation, leads to the formation of a surface-SO42– that coordinates with a single Ti ion. This adsorbate configuration is illustrated in Figure 3b, where double- and single-coordinated surface-SO42– structures are shown to the left and right of an intermediate, respectively. These structures are both stable, although the configuration where two oxygen atoms bond to two surface Ti ions has the lowest adsorption energy (Table 1). The barrier associated with a kinetic transition from the low-energy configuration has been estimated to 0.93 eV. In the reverse direction, the associated barrier height is 0.58 eV and the corresponding transfer rate is estimated to be 1678 s–1 by using an attempt frequency of 1013 s–1. This number is vanishingly small in relation to the number of adsorbed molecules. Hence, both structures are expected to exit on the surface. When the single-coordinated surface-SO42– is stabilized by a terminal or bridging OH– group, the adsorption energy is lowered by 0.26 and 0.38 eV, respectively, and the transfer rate is reduced to below 0.1 s–1. This type of stabilization is expected, since our in situ DRIFTS experiments show that hydroxyl groups disappear upon formation of surface-SO42–, indicating interaction with OH– (Figure 1). The two peaks at 3725 and 3680 cm–1 can be attributed to bridging and terminal hydroxyl groups, both of which are obtained by dissociative adsorption of H2O. The exact assignment of IR bands to different hydroxyl species still remains, however, an area of controversy, where some argue that peaks situated above and below 3680 cm–1 should be attributed to terminal and bridging OH– groups,44−47 respectively, while others argue that it is the other way around.48−50 Our calculations show that the single- and double-coordinated surface-SO42– preferably binds to bridging and terminal OH– groups (Figures 3f and 3d, respectively), where the single-coordinated structure displays a similar interaction with both hydroxyls. We note that both hydroxyls stabilize the surface-SO42– structures and that the ν(OH) frequencies are consequently red-shifted upon the formation hydrogen bonds, such that negative absorbance bands appear at 3725 and 3680 cm–1. It is also reasonable that terminal OH– groups would bind to the surface-SO42– in aqueous solutions, such that HSO4–(ads) and subsequently SO42–(aq) and H+(aq) are formed.
Comparison between Experiments and Calculations
To test the validity of the theoretical findings, the vibrational frequencies of the two surface-SO42– adsorbates were calculated and compared with the IR spectra obtained from DRIFTS. The vibrational frequencies of surface-SO32– are in poor agreement with the experimental results, and it is also unlikely that this intermediate species remain stable on the surface after exposure to oxygen and UV light. Calculated vibrational frequencies are shown in Table 1, where ν1(A1) and ν2(E) correspond respectively to the symmetric and asymmetric stretching modes of vibration within the SO3 molecular group that was not an original part of the surface. The asymmetric vibrational mode, ν2, is doubly degenerate in the free SO3 molecule, but when this molecule binds to the surface, the degeneracy is lifted, such that two asymmetric vibrational frequencies are obtained. These are denoted ν2(1) and ν2(2) in Table 1, where the first corresponds to a symmetric stretching vibration in the original SO2 group and an out-of-phase vibration relative to the third molecular oxygen, while the other involves an asymmetric stretching of the original SO2 group. For surface-SO32–, ν1, ν2(1), and ν2(2) denote the corresponding vibrations within the surface-SO3 atomic group. Bending mode frequencies are not reported, since these appear well below the experimental detection limit.
Guided by the calculated vibrational frequencies, the strongest band at 1377 cm–1 observed in DRIFTS is attributed to the ν2(2) vibration of the single-coordinated surface-SO42– structure, which has a calculated frequency of 1399 cm–1 which shifts to 1368 cm–1 in the presence of a bridging OH– group. Similarly, the corresponding ν2(1) frequency shifts from 1210 to 1158 cm–1 by interacting with the bridging OH–. This latter vibrational mode can thus be assigned to the broad peak observed at 1150–1200 cm–1. In this spectral range there is also a small contribution from adsorption of SO2 bonded at defect surface sites, which results in the formation of sulfite with an absorbance band centered at 1150 cm–1.24,29 The intensity of this band has been shown to increase on reduced surfaces, where there are oxygen vacancies present in subsurface sites, and to disappear on stoichiometric and crystalline surfaces.29 In contrast, our calculations show that surface-sulfite and surface-sulfate species are destabilized by subsurface oxygen vacancies on defect-free surfaces. The 1150 cm–1 signal in Figure 1, representing TiO2 with small concentration of defects, can thus be attributed mainly to the ν2(1) mode due to surface-sulfate. The peak measured at 1305 cm–1 is attributed to the ν2(1) vibration of the double-coordinated surface-SO42–, which has a calculated frequency of 1358 cm–1 which shifts to 1310 cm–1 in the presence of terminal OH–. The ν2(2) frequency of this adsorbate is in good agreement with previously reported IR absorption bands related to sulfate on TiO2 (1020 and 1052 cm–1).51,52 In our experiments, the S/N ratio below 1100 cm–1 was, however, too low to accurately make any unambiguous band assignments in this wavelength region.
To study how water influences the stability and vibrational frequencies of the surface-SO42– adsorbates, H2O molecules were placed at neighboring surface sites to form hydrogen bonds with the sulfate oxygen atoms (see Figures 3c and 3e). These calculations show that each water molecule stabilizes the adsorbate by ∼0.3 eV, which gives the two adsorbate configurations almost equal stability, since the single-coordinated surface-SO42– can bind to two H2O molecules. Table 1 summarizes the adsorption energies and the calculated vibrational frequencies of surface-SO42– on the clean and water precovered surface. It is evident that H2O molecules shift the frequencies downward and that these shifts are very similar to those observed experimentally in Figure 1b. The strong interaction between surface-SO42– and H2O is predicted to result in hydrophilic properties of the sulfated TiO2 surface. The surface also becomes oleophobic after photo-oxidation of SO2, which has previously been attributed to the increased surface acidity upon sulfate formation.28 Our calculations show that protonation of the surface-SO42– is not energetically feasible (see the Supporting Information), confirming the strong surface acidity of the sulfated TiO2 surface. The observed oleophobicity should also be enhanced by the large number of electronegative oxygen atoms at the surface, which would lower the surface polarizability and thereby weaken the London dispersion forces, as is the case with oleophobic fluorocarbons.53
Conclusions
The photoactivated adsorption and reaction of SO2 on TiO2 has been studied by using a combination of diffuse reflectance infrared Fourier transform spectroscopy (DRIFTS) and density functional theory (DFT). A new reaction pathway has been identified where SO2 is initially photoadsorbed in a surface-SO32– adsorbate configuration at the TiO2(101) surface and subsequently oxidized into surface-SO42–. This reaction pathway explains both the photocatalytic oxidative desulfurization process on TiO2 and the rapid deactivation of the catalyst by sulfur poisoning. The calculated vibrational frequencies are in good agreement with the experimental DRIFT spectra, and the simulations provide a plausible explanation for observed frequency shifts during water interaction with the sulfate reaction products.
This work demonstrates the importance of studying photoactivated adsorption processes on metal oxide surfaces used for photocatalysis, since this can significantly influence the stability of intermediate reaction species and also provide new adsorption pathways that are not accessible without the presence of excited charges at the surface. Here we have investigated the photo-oxidation of SO2 on TiO2, although the methods used to study the photoinduced adsorption process should be generally applicable to other reactants and transition metal oxides, in particular photoreactions of, for example, NO2, H2O, and CO2 on early transition metals.
Supporting Information Available
The Supporting Information is available free of charge at https://pubs.acs.org/doi/10.1021/jacs.0c09683.
Structural data files, XRD results, and additional information about the bonding of SO2 in the surface-SO32– configuration as well as the stabilization during addition of atomic hydrogen; information about the protonation and maximum coverage of surface-SO42– (PDF)
Notes
The authors declare no competing financial interest.
Acknowledgments
This work was financially supported by the Swedish Research Council (grant no. 2015-04757). Funding from the National Strategic e-Science program eSSENCE is greatly acknowledged. The computational work was performed on resources provided by the Swedish National Infrastructure for Computing (SNIC) at NSC. The authors acknowledge Tomas Edvinsson for sharing his allocated computation resources at (SNIC 2019/3-461).