 Local
Crystallinity in Twisted Cellulose Nanofibers
Local
Crystallinity in Twisted Cellulose Nanofibers
ACS Nano


- Altmetric
Cellulose is crystallized by plants and other organisms into fibrous nanocrystals. The mechanical properties of these nanofibers and the formation of helical superstructures with energy dissipating and adaptive optical properties depend on the ordering of polysaccharide chains within these nanocrystals, which is typically measured in bulk average. Direct measurement of the local polysaccharide chain arrangement has been elusive. In this study, we use the emerging technique of scanning electron diffraction to probe the packing of polysaccharide chains across cellulose nanofibers and to reveal local ordering of the chains in twisting sections of the nanofibers. We then use atomic force microscopy to shed light on the size dependence of the inherent driving force for cellulose nanofiber twisting. The direct measurement of crystalline twisted regions in cellulose nanofibers has important implications for understanding single-cellulose-fibril properties that influence the interactions between cellulose nanocrystals in dense assemblies. This understanding may enable cellulose extraction and separation processes to be tailored and optimized.
Introduction
Cellulose is the most abundant biomolecule on Earth, produced in the cell wall of plants and many other organisms by the condensation polymerization of glucose. The constituent polysaccharide chains typically form nanocrystalline units with dimensions that depend on the organism growing the crystals. Such “nanocellulose”, which may comprise cellulose nanofibers (CNFs) or nanocrystals (CNCs), is lightweight, strong, and chiral, leading to significant interest for sustainable materials applications ranging from biomedical scaffolds to thermal insulation foams, packaging materials, and photonic films.1−3
The mechanical and functional properties of nanocellulose and the ability of nanocellulose dispersions to form liquid crystalline phases depend on the structure, morphology, and inherent defects of the CNFs and CNCs. Bulk measurements of the atomic structure in nanocellulose, using fiber X-ray and neutron diffraction of highly crystalline specimens,4,5 typically reveal two different average crystal structures, the triclinic Iα cellulose (P1, a = 6.718 Å, b = 5.963 Å, c = 10.401 Å, α = 118.09°, β = 114.81°, γ = 80.38°) and the monoclinic Iβ cellulose (P21, a = 7.785 Å, b = 8.202 Å, c = 10.380 Å, α = 90°, β = 90°, γ = 96.5°) polymorphs. The crystallinity and crystal imperfections of cellulose fibers have been identified and quantified, e.g., using cross-polarization 13C nuclear magnetic resonance (NMR).6−8 However, these characterization techniques typically only provide information related to the bulk averaged atomic structure and crystalline domain size.9 Twisting and kinking of nanocellulose extracted from both plants and other organisms has been observed by electron microscopy and atomic force microscopy (AFM).10−12 This twist is associated with the tough, energy dissipating, cross-ply structures in the cell walls of many plants and the ability of CNCs to form cholesteric phases,3 but the local atomic and molecular arrangement in these twisted regions has remained elusive in the absence of a suitable nanoscale structural probe.
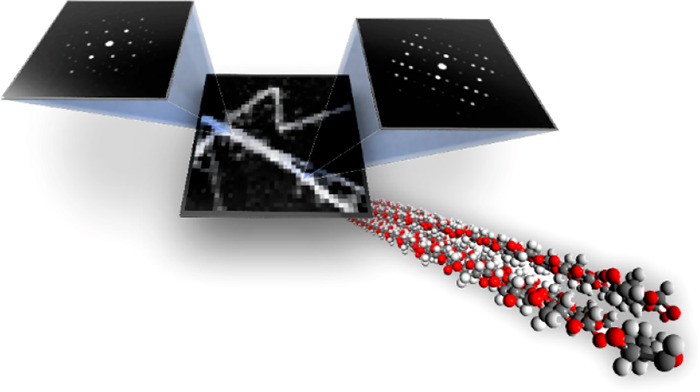
The strong electrostatic interaction between electrons and matter enables electron diffraction data to be obtained from regions on the few nanometer scale. 3D single-crystal electron diffraction methods have evolved into important techniques for structure determination of submicrometer sized crystals over the past decade,13−15 and that has now been applied to inorganic materials,16,17 small organic molecules,18,19 and proteins.20 Electron diffraction has been used for studies of the average crystal structures of cellulose down to beam sizes of ∼70 nm, and high-resolution transmission electron microscopy (TEM) images with lattice resolution have been used to study the morphology–structure relationship of individual CNFs.21−24 Dark-field (DF) TEM imaging has been used to obtain information about the crystalline microstructure of CNFs, but the small number of DF TEM images that can be formed by conventional means has left many questions unanswered.25 Scanning electron diffraction (SED) is a 4D scanning TEM (4D STEM) technique,26 in which a 2D electron diffraction pattern is recorded at every position as a focused electron probe is scanned across the sample (see Figure 1a,b). SED has recently emerged as a powerful technique for obtaining spatially resolved electron diffraction data from beam sensitive materials including molecular crystals,27 polymers,28 proteins,29 halide perovskites,30 and metal–organic frameworks.31,32 In this study, we use SED to map the crystalline microstructure of nanocrystalline CNFs with a resolution down to a few nanometers. Further, we complement our direct measurements of the local crystal structure with AFM measurements of the size and morphology of numerous CNFs.

![SED reveals local crystallinity in a twisting tunicate CNF. (a)
The electron probe is scanned in a raster pattern across the specimen,
and a diffraction pattern is acquired at each probe position. (b)
A 4D SED data set is generated comprising a 2D diffraction pattern
at each probe position in the 2D scan. (c) SED data obtained from
a sample of CNFs extracted from a tunicate. From three parts of a
single CNF, distinct zone-axis electron diffraction patterns can be
identified corresponding to the electron beam being incident along
the crystallographic directions of the cellulose Iβ structure
indicated. (d-f) The zone-axis diffraction patterns can be indexed
as the [010], [110], and [11̅0] directions of the cellulose
Iβ structure, respectively. The three orientations describe
a twist around the extended axis of the CNF, which is the crystallographic c axis aligned with the polysaccharide chain axis. The twist
angles between [010] ^ [110] and [110] ^ [11̅0] are 47 and 93°
respectively.](/dataresources/secured/content-1765907201591-16a02787-2b11-47ba-8f3c-7eb28973b57f/assets/nn0c08295_0001.jpg)
SED reveals local crystallinity in a twisting tunicate CNF. (a) The electron probe is scanned in a raster pattern across the specimen, and a diffraction pattern is acquired at each probe position. (b) A 4D SED data set is generated comprising a 2D diffraction pattern at each probe position in the 2D scan. (c) SED data obtained from a sample of CNFs extracted from a tunicate. From three parts of a single CNF, distinct zone-axis electron diffraction patterns can be identified corresponding to the electron beam being incident along the crystallographic directions of the cellulose Iβ structure indicated. (d-f) The zone-axis diffraction patterns can be indexed as the [010], [110], and [11̅0] directions of the cellulose Iβ structure, respectively. The three orientations describe a twist around the extended axis of the CNF, which is the crystallographic c axis aligned with the polysaccharide chain axis. The twist angles between [010] ^ [110] and [110] ^ [11̅0] are 47 and 93° respectively.
Results and Discussion
We extracted CNFs from a tunicate (Halocynthia roretzi) mantle (i.e., body wall) through a mild TEMPO oxidation under weakly acidic conditions at pH 5 and 40 °C, followed by wet disintegration and centrifugation.33 SED data were collected from the tunicate CNFs with ∼5 nm spatial resolution and a convergence angle of <2 mrad, as shown in Figure 1 (see also Figures 2 and 4 and Supplementary Figures 1 and 2). The measured diffraction patterns in Figure 1d–f contain sharp Bragg discs to beyond 0.55 Å–1, indicating that the crystalline quality of the specimen is good and that our SED measurement has not caused significant damage during acquisition. Along the single CNF, shown in Figure 1c, different diffraction patterns are obtained (Figure 1c–f). These diffraction patterns can be indexed to different crystal orientations of the monoclinic Iβ cellulose crystal structure, as illustrated in Figure 1c–f. This indexation of the diffraction data shows that the long axis of the CNF corresponds to the crystallographic c-axis, which is the direction of the polysaccharide chain axis (Figure 1d–f). Three distinct orientations can be identified in the selected CNF segment, corresponding to the [010], [110], and [11̅0] zone-axis orientations, which are reached sequentially moving along the CNF. This sequential change in orientation describes the trajectory of a twist around the crystallographic c axis (Figure 1d–f). Between the regions at zone-axis orientations, the diffraction patterns contain the 004 reflection, which is approximately perpendicular to the incident beam direction (see Supplementary Figure 1). The twist angles between each of the pairs of diffraction patterns can be calculated based on the geometry of the cellulose Iβ crystal structure and are ∼47° for [010] ^ [110] and ∼93° for [110] ^ [11̅0], indicating a twist rate of ∼0.65 and ∼0.63°/nm, respectively. Further, the agreement between the measured diffraction patterns and the diffraction expected for the Iβ cellulose crystal structure (see Supplementary Figure 2) demonstrates that local crystallographic ordering is preserved through the twisted regions.
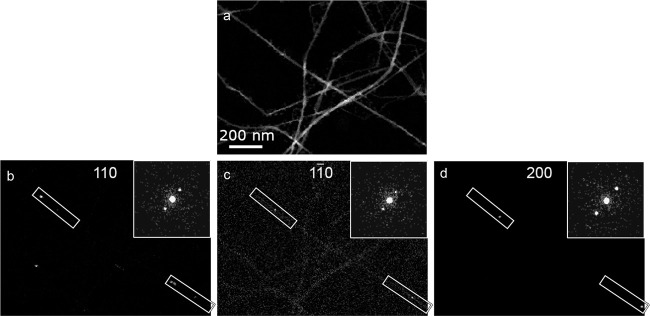
SED visualizes twisting of a tunicate CNF. By plotting the intensity within selected masks as a function of probe position, VDF images can be formed. For the case where Bragg reflections are selected, domains of the corresponding orientations are revealed. VDF images formed from (a) an annular mask and (b–d) the three selected Bragg reflections; 110, 11̅0, and 200 respectively. Representable diffraction patterns of each orientation extracted from the SED data are shown as the inset in (b–d). The sequential occurrence of the three reflections indicates twisting regions of the CNF, marked by rectangles in (b–d). The twisted regions are separated by flat domains.
The twisting of numerous CNFs in a scanned region was observed and quantified by forming virtual dark-field (VDF) images (see Figure 2). VDF images are generated by filtering each diffraction pattern in the SED data using a mask, e.g., at the position of a selected Bragg disc. In this case, the obtained maps will illuminate crystalline domains with an orientation corresponding to the selected Bragg reflection. VDF images were formed using the three strongest Bragg discs corresponding to the crystal planes (hkl) 200, 110, and 11̅0, which are associated with interchain spacing between polysaccharide chains of ∼3.87, 5.31, and 5.96 Å, respectively. These VDF images reveal where these reflections come into the Bragg condition. The observation that these Bragg conditions are sequentially met along the CNFs indicates that parts of the fibers are twisted. This twisting is not continuous, as the sequence of reflections appears in short sections separated by regions where the CNF lies flat on the support grid. In the twisting sections of the fibers, the pitch of the twist can be determined based on the distance between the measured orientations. Following this, a twist rate can be determined as the angle by which the fiber is twisting per nanometer. The average twist rate between the 11̅0 ^ 200 reflections is 0.65 ± 0.18°/nm and between the 110 ^ 11̅0 reflections is 0.63 ± 0.14°/nm, with errors reported as one standard deviation.
We use atomic force microscopy (AFM) to assess the morphology of numerous CNFs, as shown in Figure 3, and relate this morphology to the twisting observed directly using SED. An automated method was implemented to extract the height profile from a 3-pixel-wide line along the center of each CNF, and the histogram of CNF heights, shown in Figure 3b, comprises a distribution modeled as three normal distributions with mean values at 3.0 ± 1.5, 7.4 ± 2.0, and 13.0 ± 2.9 nm. By considering the spatial distribution of these height measurements, we determine that the distributions around 3.0 and 7.4 nm correspond to isolated CNFs, whereas the distribution around 13.0 nm, which is broader, corresponds primarily to regions where CNFs are overlapping. The analysis of many CNFs showed that individual CNFs could also display thicker regions separated by domains of uniform thickness (Figure 3c). The increased thickness of the individual CNFs indicates the parts of the CNFs that are twisted with respect to the extended regions of very consistent thickness, which is similar to our SED observations. We use the large amount of data extracted from analysis of the AFM height images to provide more insight into the tunicate CNFs twisting.
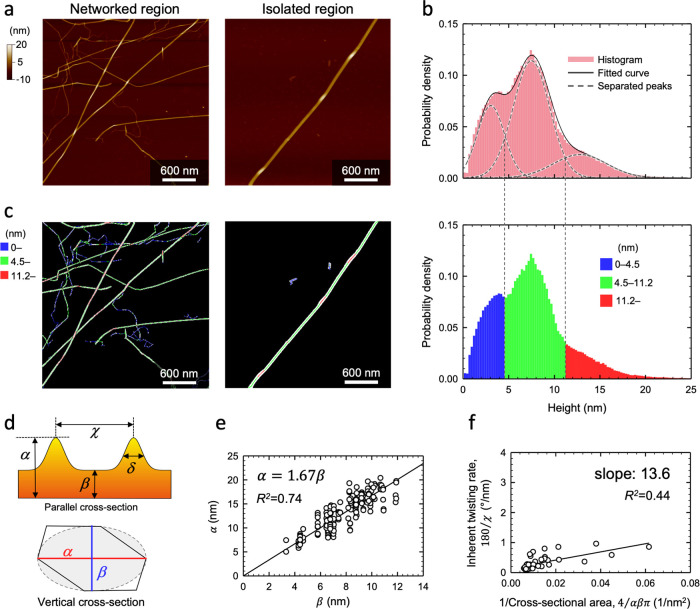
Atomic force microscopy of twisted tunicate CNFs. (a) Height images of networked and isolated regions of the tunicate CNFs deposited on a flat substrate. (b) Histogram of the height profile along a 3-pixel-wide center line of each CNF, which is fit to three Gaussians and separated into three size groups (blue, green, and red) that are mapped in (c). The isolated CNF includes locally thick, red domains resulting from the twisting of the CNFs. (d) The cross-sectional models parallel and vertical to the fiber axis of the twisted CNF where α is the peak height at the locally twisted part, β is the height of the flat region, δ is the full width at half-maximum (fwhm) of the peak profile in the twisted region, and χ is the distance between the subsequent two peaks. The heights α and β correspond to the longest and shortest dimensions of the vertical cross section, which is modeled as an ellipse based on the truncated parallelogram shape observed by Helbert et al. (e) The linear correlation between α and β indicates a geometric similarity of the cross-sectional shapes. (f) The inherent twist rate, given by 180/χ, as a function of the reciprocal of the vertical cross-sectional area.
By measuring the thickness of the CNFs in the flat sections as well as in twisted regions, the shortest and longest sides of their cross section, defined in Figure 3d, could be determined. A correlation of the two dimensions, as shown in Figure 3e, indicates that the dimensions of the cross section are highly correlated and there is geometrical similarity of the cross-sectional shape along the CNF. To evaluate the twist rate given that twisting is highly localized to specific regions, we note that the CNFs are hydrophilic and have high free-energy surfaces, such that the interaction with the hydrophilic substrate affects the way the fiber behaves. As the fibers dry on the substrate, the twisting forces of the fiber will be balanced by the surface interaction, and the flat sections of the fibers are formed with the larger side of the cross section preferentially lying flat on the substrate.10,24 This localizes the twisted region along the CNFs as observed by AFM and SED. This means that the local twist rate of the twisting domains will be determined by balancing of the inherent driving force for the twist and the surface interaction. The local twist rate can be measured from both SED and AFM data by tracing the fiber as it is twisting. The inherent driving force for twisting will be reflected by the distance between subsequent twists of 180°, given that the fiber is drying uniformly on the substrate. This can be used to estimated the inherent twist rate of the fiber, which will be related to the twist rate of an isolated fiber. Based on the AFM data, the interval between twists is related to the cross-sectional area of the given fiber. The cross section area of the fiber was determined from the longest and shortest dimensions of the cross section, assuming elliptical geometry. The inherent twist rate is then found to be proportional to the inverse of the cross-sectional area, as shown in Figure 3f, with a measured slope of 14°/nm. This is in agreement with previously reported molecular dynamics simulations where a similar relationship was observed for smaller CNFs giving a computed slope of ∼16°/nm.34 Our observations therefore provide experimental corroboration of these molecular dynamics simulations. The average inherent twist rate, as calculated based on subsequent twists, over all measured fibers was 0.26 ± 0.16°/nm, which is similar to 0.24 ± 0.09°/nm as determined from the SED data based on the distance between consecutive appearances of the same orientation along a CNF after a twist; see the Methods section for more details.
The high spatial resolution, ∼5 nm, of our SED measurements and the 2D raster scan, which is different from earlier sequentially acquired electron diffraction study studies such as Ogawa,24 allows us to map out local crystalline ordering and explore variations in crystallinity transverse to the fiber axis of cellulose nanofibers. We compare this local crystallinity in tunicate CNFs and bacterial CNCs, which twist similarly to the CNFs (see Supplementary Figure 7), using VDF imaging, as shown in Figure 4. VDF images were formed both by integrating selected Bragg reflections, to produce diffraction contrast images, and by integrating between scattering angles of 4–10 mrad, to produce an annular dark-field scanning TEM image. VDF images formed from each of the strongest Bragg reflections observed from a tunicate CNF, Figure 4a, show that the corresponding crystalline regions extend uniformly across the width of the CNF. The CNF therefore comprises approximately a single crystal transverse to the fiber. The crystalline domains are slightly narrower than the morphological dimensionality of the CNF as evidenced by line traces across the CNF (Figure 4c,d) in VDFs formed using the 200 and 004 reflections and annular masks. In contrast, VDF images formed using the strongest Bragg reflections recorded from a bacterial CNC, Figure 4b, show more fragmented bright regions, also observed in the line traces in Figure 4e,f. This indicates the crystals in the CNCs are not as uniform in microstructure and that the CNCs are composed of smaller discrete entities, in slightly different orientations, which together form the strongly anisotropic ribbon-like morphology. Although thinner in morphology, the crystalline domains in the tunicate CNFs are wider than the corresponding domains of the bacterial CNCs. This corresponds well with crystal sizes determined from PXRD data using the Scherrer equation, which yields crystalline domains in tunicate CNFs of 7.3–9.5 nm, depending on direction, and crystalline domains in bacterial CNCs of 5.2–5.7 nm. These observations are also in agreement with earlier findings.35,36
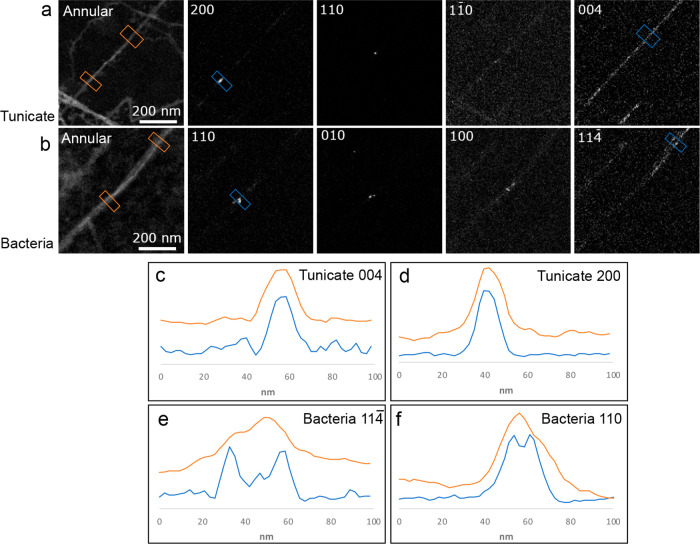
Revealing crystallinity transverse to the fiber axis using SED. VDF images generated using the SED data obtained from (a) tunicate CNFs and (b) CNCs of bacterial origin. Annular VDF images show the overall morphology of the CNF/CNC. VDF images generated by integrating windows containing selected key reflections show the domains of given orientations. (c–f) Line traces across the CNF/CNC, comparing the same domains of the annular (orange) and reflection (blue) VDF maps. The tunicate CNFs have an approximately uniform crystallinity extending over the cross section of the fiber as seen in (c) and (d), whereas the CNCs of bacterial origin exhibit fragmented domains as shown by the split in the blue traces in (e) and (f). The line trace from the annular map of the tunicate CNFs shows a slightly wider profile compared to the line trace from 004 and 200 reflections indicating that the CNF is not crystalline through its entire width. The Bragg reflections are indexed with respect to the Iβ and Iα cellulose crystal structures for tunicate and bacterial cellulose, respectively.
Conclusions
SED analysis has revealed crystalline ordering within twisting cellulose nanofibers. The polysaccharide chains of tunicate CNFs were found to be packed in the Iβ cellulose crystal structure and to remain well ordered as the cellulose fiber twists through 180° about its long axis. The SED data also shows that the fibers extracted from a tunicate show crystallinity throughout the cross section of the fiber with a homogeneous crystal orientation. CNCs of bacterial origin however possess a more complex microstructure where smaller domains of different orientations are present. Our AFM study reveals that the twist rate is inversely proportional to the cross-sectional area of the fiber. We have shown that this is true for both the inherent twist as well as the local twist rate after the CNF is dried onto a substrate. The relationship between the twist rate and the cross-sectional area of the fibers has now been shown experimentally and is consistent with earlier reported results from modeling. These results are a demonstration of the mechanical robustness of cellulose crystallites. The twisting structure is localized yet still ordered at the level of molecular packing as revealed by SED analysis. This shows that cellulose nanofibers can preserve crystalline molecular stacking even after being significantly twisted. It is anticipated that SED will become an important tool for revealing fine details of the molecular ordering within the microstructure of single cellulose fibrils and other crystalline biopolymers.
Methods
Preparation of CNFs and CNCs
Tunicate CNFs were prepared from a purified mantle of Halocynthia roretzi via a 4-acetamido-TEMPO/NaClO/NaClO2 oxidation reaction, according to a previously reported protocol.33 The pH value and temperature of the reaction medium were maintained at approximately 5 and 40 °C, respectively. After 3 days, the oxidized mantle was purified with distilled water and suspended in water at a solid consistency of 0.05% w/w. The suspension (200 mL) was mechanically treated using a Microtec Physcotron NS-56 double-cylinder-type homogenizer at 7500 rpm for 8 min and then sonicated with a Nissei US-300T ultrasonic homogenizer (300 W, 19.5 kHz) at 70% output for 1 min. The CNFs were separated as stably dispersed particles in the supernatant by centrifugation of the sonicated suspension. A PXRD pattern from the tunicate CNFs is shown in Supplementary Figure 3.
Bacterial CNCs were prepared from commercially available coconut gel cubes (Chaokoh, Thailand), known as nata de coco. The coconut cubes were first soaked in deionized water to remove sugar and other additives and then stirred in 0.1 M sodium hydroxide solution for 48 h and rinsed until neutral. Purified coconut cubes (100 g) were hydrolyzed by 40 w% sulfuric acid solution at 80 °C for 4 h. The reaction was quenched by water dilution of 10 times, and the slurry was collected by centrifugation and dialyzed for 3 days against deionized water using dialysis bags (cutoff weight of 14 000 Da). Finally, the suspension was probe sonicated for 10 min (output power of 60%, Q2000, Qsonica), followed by centrifugation for 30 min at 8000 rpm (removing titanium particles). A PXRD pattern from the bacterial CNCs is shown in Supplementary Figure 4.
AFM Measurements
To prepare samples for AFM, the CNF dispersion was diluted to 0.001% w/w, dropped onto a freshly cleaved mica plate, and dried in a desiccator at ambient pressure. The AFM measurements were performed using a Bruker MultiMode 8 microscope equipped with a NanoScope V controller and a ScanAsyst-Air probe with a low spring constant of 0.4 N/m and a tip diameter of 2 nm. This instrument was operated in PeakForce Tapping mode with monitoring to ensure that the repulsion time was ∼10%. The tapping step was set at ∼2 nm with 1024 × 1024 pixels covering ∼2-μm-wide squares. The microscope was covered with an acoustic hood during the observation to minimize vibrational noise.
AFM Data Analysis
The heights of all the CNFs in the AFM images were extracted by automated image processing, as shown in Supplementary Figure 5, performed using the scikit-image and OpenCV Python 3.6.3 libraries. The images were first binarized to separate the CNFs from the background, and locally adaptive thresholding was applied to the regions above 0.5 nm. Noise and contaminations were then removed from the binarized images using a line detection algorithm, as follows. A probabilistic Hough transform was applied to each connected component after Canny edge detection, and the component was treated as noise if the ratio of the detected lines to the Canny edges was less than 0.35. The center lines of each CNF were then extracted using a skeletonization algorithm giving 1-pixel-wide center lines that were expanded to 3-pixel-wide center lines by dilation. Histograms of height obtained from the binarized regions, the 1-pixel-wide center lines, and the 3-pixel-wide center lines are shown in Supplementary Figure 5. The height distribution remained unchanged after dilation of the center lines, indicating that the detected center lines were close to the ridge lines of the CNFs. The histogram obtained from the 3-pixel-wide center lines was further analyzed by curve fitting with a Gaussian function.
The analysis of twisting parts was carried out for the isolated fibers in the AFM images. The center of each CNF was tracked manually by using ImageJ version 1.52 a. Several values were calculated from a height profile (Supplementary Figure 5), where the twisting parts appeared as distinct bumps. The twisting height and interval of the twisting were measured at peak maxima. A linear background was applied for each peak range, and the width was calculated at 10% peak height from the background. The height of the untwisted region was calculated as the average of the height profile excluding peak regions.
SED Experiments
The dispersion of CNF/CNC was diluted to a concentration of 0.001% w/w. The ultrathin continuous carbon film covered TEM grids (Electron Microscopy Sciences) were initially glow discharged before a droplet of the dispersion was applied to the grid. The grid was left for 1 min before the remaining dispersion was blotted away and the grid was dried at ambient conditions. SED data were acquired using a JEOL ARM300CF fitted with an ultrahigh-resolution pole piece, a cold-field emission gun, and aberration correctors in both the probe-forming and image-forming optics (Diamond Light Source, UK). The instrument was operated at 300 kV in a nanobeam configuration obtained by switching off the aberration corrector in the probe-forming optics and using a 10 μm condenser aperture to obtain a convergence semiangle of ∼0.6 mrad and a diffraction-limited probe diameter of ∼5 nm. The probe current was measured using a Faraday cup as ∼2.3 pA, and the exposure time was 1 ms per probe position. The estimated electron fluence, assuming a disk-like probe, was ∼6 e–/Å2. A diffraction pattern was acquired at every probe position using a Merlin-Medipix hybrid counting-type direct electron detector (Quantum Detectors, UK). SED was obtained in a “blind scanning” point-and-shoot workflow to minimize the total electron fluence the specimen received.
Postprocessing and visualization of the SED data was performed using the open-source Python library Pyxem 0.10.0.37 The postprocessing of the SED data involved alignment of the diffraction patterns using a cross-correlation algorithm applied to the direct beam and the creation of VDF images based on an annular mask to integrated selected regions of the detector plane, containing particular Bragg reflections, as a function of probe position. The calculations of the local twist rate were based on the known geometry of the cellulose crystal structure and the distance along the fiber separating the given crystallographic orientations. The local twist rates between [010] ^ [110] and [110] ^ [11̅0] orientations were calculated to be 0.65 and 0.63°/nm, respectively, with standard deviations of 0.18 and 0.14°/nm. The calculations were based on 21 and 12 measurements, respectively. The inherent twist rate was determined by measuring the distance between consecutive appearances of the same crystallographic orientation along a CNF after undertaking a twist of 180°. The estimate of the inherent twist rate of 0.24°/nm was calculated by relating the distance to the 180° twist to obtain an estimate of the inherent twist rate of the CNF after dried onto the carbon substrate.
Supporting Information Available
The Supporting Information is available free of charge at https://pubs.acs.org/doi/10.1021/acsnano.0c08295.
Author Contributions
T.W. conceived the project. K.D. and Y.L. prepared the CNF and CNC material. T.W. and D.N.J. performed the SED data collection and analysis. K.D. and K.K. performed the AFM measurements and data analysis. T.S., L.B., and P.A.M. supervised the project. All authors have been involved in discussing the results as well as commenting on the manuscript.
Notes
The authors declare no competing financial interest.
Notes
Raw SED data used in this study is available from 10.5281/zenodo.3979488.
Notes
This work was previously submitted to the preprint server ChemRxiv.38
Acknowledgments
T.W. acknowledges grants from the Swedish Research Council (VR, 2019-05465) and the Swedish Foundation for Strategic Research (ITM17-0301). This work was performed with the kind support of STINT (Dnr SJ2017-7457). K.D., K.K., and T.S. acknowledge a grant from the JST-Mirai R&D program (JPMJMI17ED). P.A.M. acknowledges the Engineering Physical Sciences Research Council (EPSRC), UK, (EP/R008779/1). Y.L. and L.B. acknowledge Wallenberg Wood Science Centre (KAW 2018.0452). We acknowledge access and support in the use of the electron Physical Science Imaging Centre (EM19130 and EM20614) at the Diamond Light Source.