
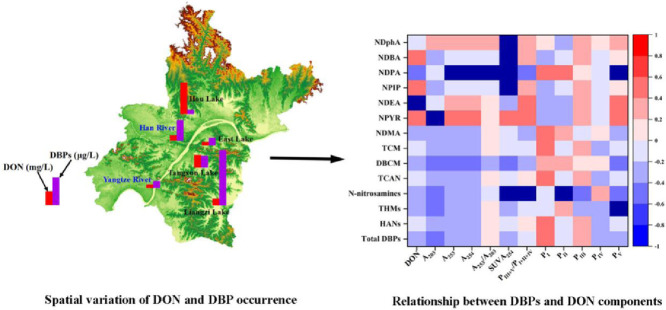
Intensified sanitization practices during the recent coronavirus disease-2019 (COVID-19) led to the release of chlorine-based disinfectants in surface water, potentially triggering the formation of disinfection byproducts (DBPs) in the presence of dissolved organic nitrogen (DON). Thus, a comprehensive investigation of DON's spatial distribution and its association with DBP occurrence in the surface water is urgently needed. In this study, a total of 51 water samples were collected from two rivers and four lakes in May 2020 in Wuhan to explore the regional variation of nitrogen (N) species, DON's compositional characteristics, and the three classes of DBP occurrence. In lakes, 53.0% to 86.3% of N existed as DON, with its concentration varying between 0.3–4.0 mg N/L. In contrast, NO3−-N was the dominant N species in rivers. Spectral analysis revealed that DON in the lakes contained higher humic and fulvic materials with higher A254, A253/A203, SUVA254, and PIII+IV/PI+II+V ratios, while rivers had higher levels of hydrophilic compounds. Trihalomethanes (THMs) were the most prevalent DBPs in the surface waters, followed by N-nitrosamines and haloacetonitriles (HANs). The levels of N-nitrosamines (23.1–97.4 ng/L) increased significantly after the outbreak of the COVID-19 pandemic. Excessive DON in the surface waters was responsible for the formation of N-nitrosamines. This study confirmed that the presence of DON in surface water could result in DBP formation, especially N-nitrosamines, when disinfectants were discharged into surface water during the COVID-19 pandemic.

| 3D-EEM | Three-dimensional fluorescence excitation-emission matrix |
| BDCM | Bromodichloromethane |
| C | Carbon |
| C-DBPs | Carbonated DBPs |
| COD | Chemical oxygen demand |
| DBCM | Dibronochloromethane |
| DBPs | Disinfection byproducts |
| DO | Dissolved oxygen |
| DOM | Dissolved organic matter |
| DON | Dissolved organic nitrogen |
| EC | Electrical conductivity |
| HANs | Haloacetonitriles |
| N | Nitrogen |
| NDBA | N-nitrosodibutylamine |
| NDEA | N-nitrosodiethylamine |
| NDMA | N-nitrosodimethylamine |
| NDPA | N-nitrosodi-n-propylamine |
| N-DPBs | Nitrogenous DPBs |
| NDphA | N-nitrosodiphenylamine |
| NMEA | N-nitrosomethylethylamine |
| NMOR | N-nitrosomorpholine |
| NPIP | N-nitrosopiperidine |
| NPYR | N-nitrosopyrrolidine |
| TBM | Bromoform |
| TCAN | Trichloroacetonitrile |
| TCM | Chloroform |
| TIN | Total inorganic nitrogen |
| TN | Total nitrogen |
Dissolved organic nitrogen (DON) refers to the nitrogenous fraction of dissolved organic matter (DOM). This fraction comprises easily decomposable, mineralizable nitrogen (N), which provides available substrates for microbial utilization (Wang et al., 2018). As the available pool of N, DON has a rapid turnover and plays a vital role in the N cycle. DON is ubiquitous in surface water. Typical DON concentration in surface water lies in the range of 0.02–10.0 mg N/L with a mean of approximately 0.3 mg N/L (Seitzinger and Sanders, 1997; Westerhoff and Mash, 2002; Xu et al., 2010; Yao et al., 2020). Excessive DON can lead to eutrophication and acidification (Yao et al., 2020). Furthermore, when surface water is treated for drinking purposes, DON can react with chlorinated disinfectants to form disinfection byproducts (DBPs) (Gu et al., 2011; Mazhar et al., 2020). The presence of DON in surface water will proliferate the formation potential of DBPs, posing a considerable threat to human health.
Population growth and large-scale anthropogenic activities have increased the discharge of exogenous DON, such as chemical fertilizer, animal and human excrement, sewage, and litter amount in surface water (rivers and lakes) (Chen et al., 2019; Hu et al., 2016). Considerable variations are expected in the amount and compositional characteristics of DON in surface water due to diverse sources. Although the concentration of DON has been reported in a few surface water bodies, data on the spatial variation of DON at a regional scale are still limited. Besides, identification of the chemical components of DON is challenging, owing to its extremely complicated structural composition.
As is well-known, determining the composition and structure of DON is the characterization of DOM with a particular focus on the N fraction (He et al., 2015; Hu et al., 2020). Multiple technologies are often used in conjunction to analyze the compositional structure of DOM (Zhang et al., 2020c). Specific ultraviolet-visible (UV-vis) adsorption spectrum is widely used as an index to reflect the aromatic content of DOM (He et al., 2011; Hudson et al., 2008; Li et al., 2000). Recent studies have demonstrated the use of three-dimensional fluorescence excitation-emission matrix (3D-EEM) to observe the fluorescence peaks of DOM (Carstea et al., 2019; Maqbool et al., 2020). The fluorescence peaks represent five typical fluorophores, including tyrosine-like, tryptophan-like, fulvic acid-like, soluble microbial product-like, and humic acid-like.
Wuhan, a metropolitan, is the capital of the Hubei Province, with a population of 11.2 million (Fu et al., 2020). This city is located in the middle reaches of the Yangtze River, specifically at the convergence point of the Yangtze River and its largest tributary (the Han River). In Wuhan, the centralized surface water for drinking is mainly procured from the Yangtze River, the Han River, and some lakes, which is crucial for human survival. However, rapid urbanization poses a significant risk to the quality of water in these pristine water bodies.
The recent outbreak of the coronavirus infectious disease-2019 (COVID-19) has proliferated the use of chlorine-based disinfectants for eliminating pathogenic microorganisms in contaminated environments (e.g., hospitals, sewage disposal plants) throughout Wuhan city (Zhang et al., 2020a). Residual disinfectants might enter natural water bodies and facilitate DBP formation depending upon the availability of DON. Most research articles before the outbreak of the COVID-19 pandemic indicated that DBPs could not be detected in surface water. Recently, Li et al. (2021) reported the presence of DBPs in surface water after the outbreak of the COVID-19 pandemic, discussing the effects of disinfected water (including wastewater effluents and tap water) on DBPs occurrence. Nevertheless, the occurrence of DBPs in surface water in the presence of DON after the outbreak of the COVID-19 pandemic is still unclear.
To investigate DON contamination in surface waters and its correlation with DBP occurrence influenced by the COVID-19 pandemic, typical surface water bodies (two rivers and four lakes) of Wuhan city were selected. Our primary objective is to: (1) characterize the spatial and compositional variation of DON in surface water resources in Wuhan; (2) investigate the occurrence of DBPs in surface waters during the COVID-19 pandemic; (3) explore the relationship between DON concentration, properties, and DBP occurrence.
The study area is located in Wuhan City (Hubei Province) in central China (29°58′ N–31°22′ N; 113°41′ E–115°05′ E) (Fig. 1 ). The Yangtze River catchment of Wuhan city with one main tributary (Han River) is the most important river with an annual water supply of 8.4×10⁸ m3. Out of the hundreds of lakes in this city, four lakes (Tangxun Lake, East lakes, Hou Lake and Liangzi Lake) were selected for further assessment. Tangxun Lake and East Lake are the largest and second-largest urban lakes in China, with water areas of 47.6 and 33.0 km2. Hou Lake and Liangzi Lake are located in the northwest and southeast of Wuhan City. The study area is characterized by a subtropical monsoon climate with four distinct seasons. The mean annual temperature is 15.8℃–17.5℃, with 40% of total rainfall occurring during the rainy season from June to August.
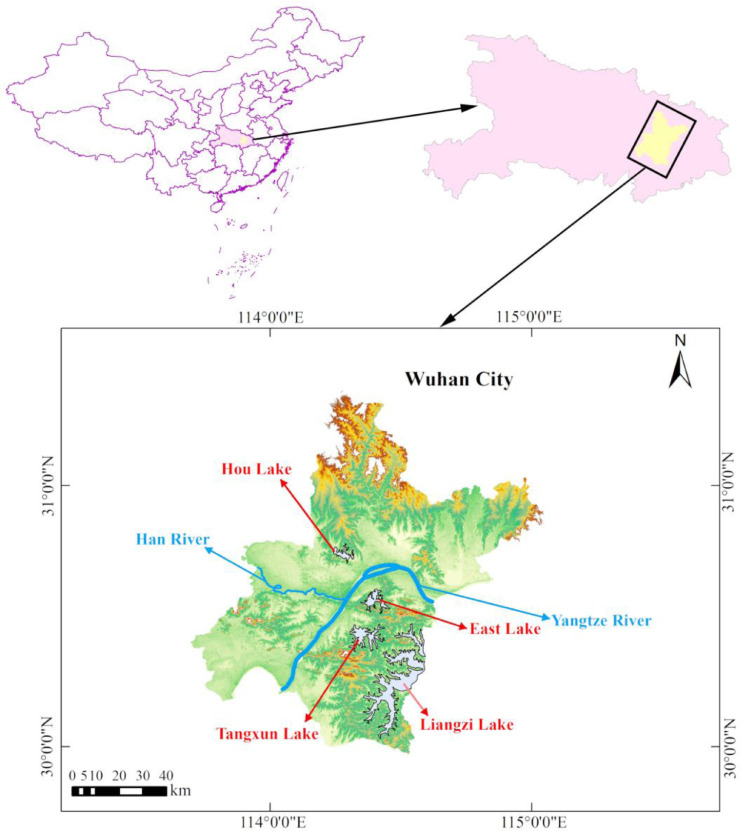
Location of the study area
Water samples were collected from 51 sampling sites located in two rivers (the Yangtze River catchment of Wuhan and Han River) and four lakes (Tangxun Lake, Dong lake, Liangzi Lake and Hou Lake) in May 2020 (Fig. 2 ). We ensured that the sampling points covered the entire study area. The Yangtze River and Han River contained a total of 10 and 6 sampling locations, respectively. The number of sampling sites in Tangxun Lake, Dong lakes, Liangzi Lake, and Hou Lake was 10, 8, 11, and 6, respectively. The samples were packed in amber glass bottles without allowing any headspace and refrigerated immediately. Later, the samples were brought back to the laboratory, filtered using Whatman nylon membrane filters (pore size of 0.2 μm; 47 mm diameter; Germany), and stored at 4℃ for subsequent analysis.
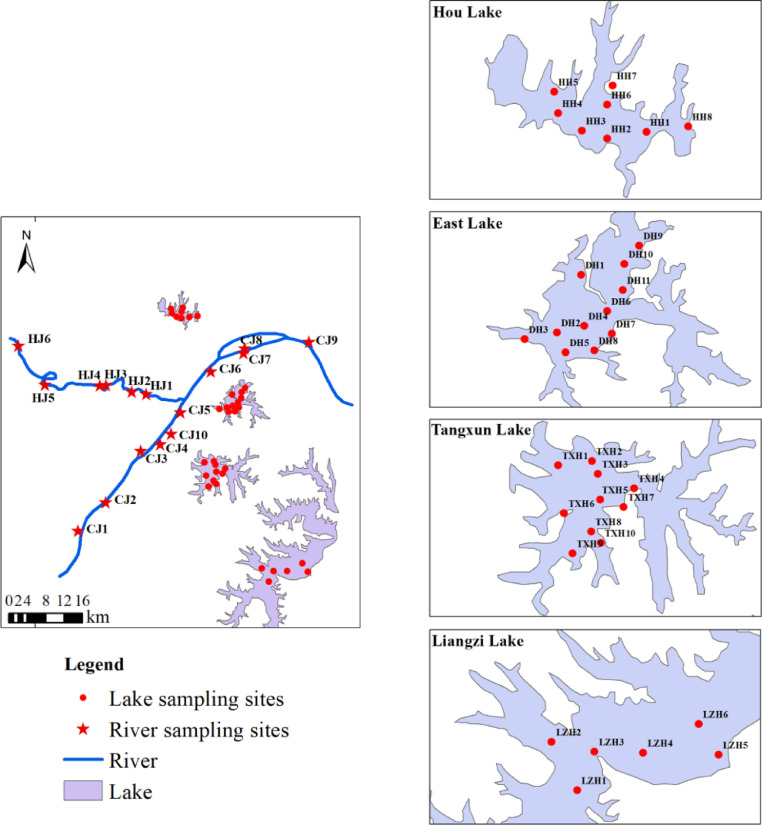
Location of the sampling sites. CJ: Yangtze River; HJ: Han River; TX: Tangxun Lake; DH: Dong lakes; HH: Hou Lake; LZH: Liangzi Lake.
pH, electrical conductivity (EC), dissolved oxygen (DO), and turbidity of the samples were measured in situ using a multi-parameter monitor (HQ40d, HACH, USA) and a turbidimeter (2100N, HACH, USA), respectively. Chemical oxygen demand (COD) was determined by reflux digestion with potassium dichromate (K2Cr2O7) and excess K2Cr2O7 was titrated against ferrous ammonium sulfate (Li et al., 2018). Dissolved organic carbon (DOC) was analyzed using a TOC analyzer (TOC-L CPH, SHIMADZU, Japan). Total organic chlorine (TOCl) and total organic bromide (TOBr) were identified using a precombustion station (AQF-2100H, Mitsubishi Chemical Analytech, Japan) with an ion chromatography (ICS-5000, DIONEX, USA).
Ammonium nitrogen (NH4 +-N) and total nitrogen (TN) were quantified using Nessler's reagent spectrophotometry and the potassium persulfate digestion ultraviolet-visible spectrophotometric method (UV1601, Beijing Rayleigh, China). Nitrite-nitrogen (NO2 −-N) and nitrate-nitrogen (NO3 −-N) were determined by an ion chromatography (ICS-2000, DIONEX, USA) equipped with an anion exchange column (Shenghan SH-AC-5, 250 mm×4.6 mm) and a conductivity detector (Long et al., 2019). Total inorganic nitrogen (TIN) was calculated as the sum of NH4 +, NO2 − and NO3 −. DON was computed from the difference between TN and TIN (Liu et al., 2012).
Specific ultraviolet absorbances at 203, 253 and 254 nm (A203, A253, A254) were recorded using a 1 cm quartz cuvette to identify the chemical components of DON (UV1601, Beijing Rayleigh, China). SUVA254 was calculated from the 100-fold ratio of the specific ultraviolet absorbance at 254 nm to the corresponding DOC concentration. A253/A203 is the ratio of ultraviolet absorbance at 253 nm to that at 203 nm. A fluorescence spectrometer (F-2500, HITACHI, Japan) was used to characterize the 3-dimensional excitation-emission matrix (3D-EEM). The spectrum was acquired at excitation (Ex) and emission (Em) wavelengths of 200–400 and 200–500 nm, respectively, at 5 nm intervals and a 1200 nm/min scan rate.
Due to the physicochemical properties of N-enriched DOM, carbonated DBPs (C-DBPs) and nitrogenous DBPs (N-DBPs) may be produced when chlorine-based disinfectant enters surface water. Thus, three typical classes of DBPs (trihalomethanes (THMs) and haloacetonitriles (HANs), N-nitrosamines) were quantified in this study. THMs, including chloroform (TCM), bromoform (TBM), dibromochloromethane (DBCM), and bromodichloromethane (BDCM), were detected directly by purge and trap concentrator-Gas Chromatography- Mass Spectrometer (GC-MS) (7890B-5977C, AGLENT, USA). HANs which included trichloroacetonitrile (TCAN) was determined by Gas Chromatography-Election Capture Detector (GC-ECD) (7890A, AGLENT, USA). N-nitrosamines, comprising N-nitrosodimethylamine (NDMA), N-nitrosomorpholine (NMOR), N-nitrosopyrrolidine (NPYR), N-nitrosomethylethylamine (NMEA), N-nitrosodiethylamine (NDEA), N-nitrosopiperidine (NPIP), N-nitrosodi-n-propylamine (NDPA), N-nitrosodibutylamine (NDBA) and N-nitrosodiphenylamine (NDphA) were detected using solid-phase extraction (SPE) and Liquid Chromatography-Mass Spectrometer/Mass Spectrometer (LC-MS/MS) (LCMS-8060, SHIMADZU, Japan). TBM, BDCM, NMOR, and NMEA were not detected in the samples.
The concentration of each DBPs below the method detection limit (MDL) was treated as zero to avoid incorrect conclusion and bias. The results were reported as the mean and the standard deviation computed from three replicates. Statistical analysis was performed using IBM SPSS statistics 26.0 software package for Windows 10. The significance of the differences among the distinct water bodies was ascertained using the analysis of variance (ANOVA) followed by Duncan's multiple range test. Spearman's rank correlation coefficients were calculated to identify the relationships among the levels of DBPs, DON-related indices, and physicochemical characteristics. For this study, a correlation coefficient greater than or equal to 0.7 (r ≥ 0.7) was defined as a strong correlation. Correlation coefficient values between 0.4 and 0.7 (0.4 ≤ r < 0.7) were considered moderately strong, and below 0.4 (r < 0.4) were considered weak (Haldar et al., 2020). Principal component analysis (PCA) was also performed to provide a rough overview of the reduced dimensions of parameters and sample clustering using Origin 2021. The differences were considered statistically significant at p < 0.05.
The physical and chemical properties of water samples collected from two rivers and four lakes, including pH, EC, DO, turbidity, COD, DOC, TOCl, TOBr and N species, were summarized in Table S1 and Fig. 3 .
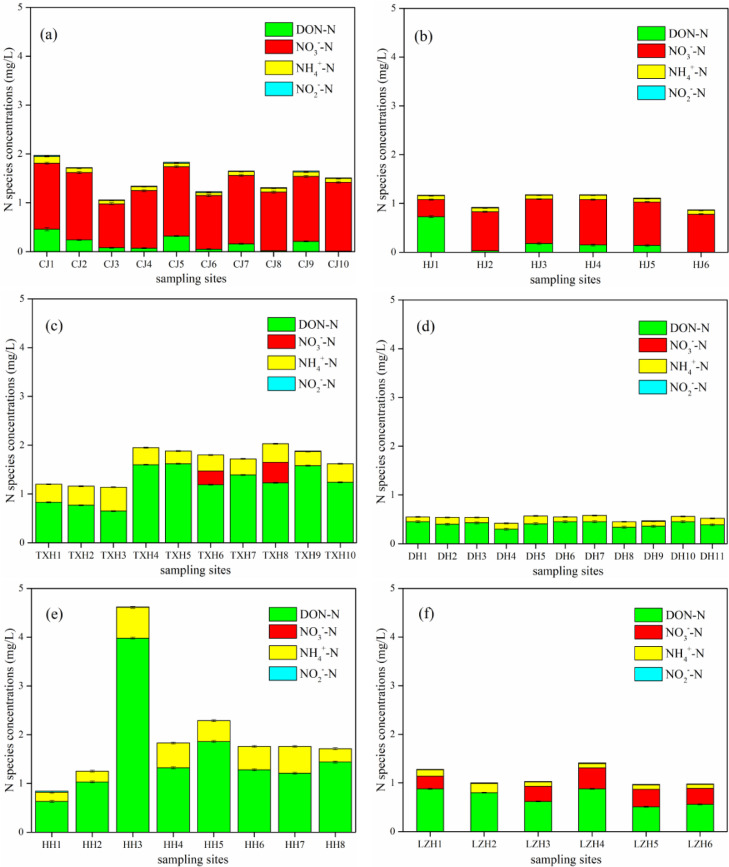
Variation in different N forms concentrations at the sampling sites. (a) Yangtze River, (b) Han River, (c) Tangxun Lake, (d) Dong lakes, (e) Hou Lake, (f) Liangzi Lake. Data are given as the mean of triplicates, and error bars indicate deviation from the mean.
The results indicated different levels of variation in water quality among different water resources. A significant variation was demonstrated by statistical analysis (ANOVA, p < 0.05) for pH, EC, Turbidity, COD, DOC, TOCl, and TOBr. Most water quality parameters in lakes exhibited significantly higher levels than in rivers. For example, the results showed that DOC concentrations were 1.5–4.4 mg/L in rivers and 1.5–9.8 mg/L in lakes, respectively. Average DOC concentrations in different surface water resources were in the order Hou Lake > Tangxun Lake > East Lake > Liangzi Lake > Han River > Yangtze River. Yangtze River had the lowest DOC concentrations (1.5–3.3 mg/L), while Hou Lake had the highest DOC values (3.4–9.8 mg/L) among all water resources. Generally, the lakes in this study were characterized by higher EC, turbidity, COD, DOC, and TOCl values, indicating that their water quality was worse than rivers. This could be mainly attributed to discharge from different pollutant sources such as rainfall, surface runoff, overuse of fertilizers, sewage, and domestic effluents (Hu et al., 2016; Maqbool et al., 2020).
To further identify primary sources of spatial variability in water quality, PCA of the water quality parameters was performed (Fig. 4 ). Detailed information about pollutants was summarized in Table S2-S6. As shown in Fig. 4, the different types of water samples showed distinct clusters with the two principal components accounting for 62.7% of the variances. Rivers and lakes clustered in different quadrants due to their distinct pollutant sources. PC1 explained 42.3% of the total variance with strong positive loadings of DON, COD and NH4 +. Tangxun Lake and Hou Lake exhibited higher values on the PC1 axes, which can be associated to large discharges of sewage and industrial waste directly unloaded into lakes. Especially in Hou Lake (Table S5), the direct discharge of domestic sewage and dumping of animal and industrial waste in the nearby areas were the major pollutant sources due to the poor drainage pipe network. PC2 explained 20.4% of the variance and had high positive loadings of DO, NO3 −-N and NO2 −-N. Rivers showed higher values on the PC2 axes, which was probably due to the application of organic and inorganic N fertilizers into rivers. Table S2 also showed that the amount of NH4 + and COD from agricultural runoff was higher than from other sources.
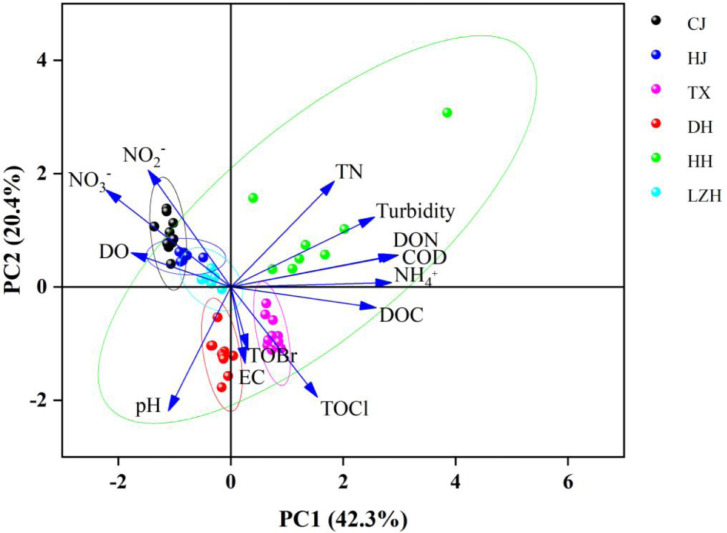
PCA of the water quality parameters of the distinct water bodies. The blue straight lines with arrows represent the physicochemical properties of surface water. The clusters of dots indicate the sampling sites with the same water quality pattern.
The different predominant N forms (DON, NO3 −-N, NH4 +-N, NO2 −-N) in surface water resources were analyzed in this study (Fig. 3). DON, NO3 −-N, NH4 +-N and NO2 −-N concentrations varied from 0 to 4.0, 0 to 1.4, 0.06 to 0.5, and 0 to 0.02 mg N/L, exhibiting a substantial spatial variation in distinct water resources and a slight change in the same water resource. The TN content of the rivers and lakes varied between 0.9 to 2.0 and 0.4 to 4.6 mg N/L, respectively. The ranking order of the average TN concentrations of the six surface water resources was Hou Lake > Tangxun Lake > Yangtze River > Liangzi Lake > Han River > East Lake. Based on the results of PCA, the primary source of pollution in rivers was agricultural runoff, while the primary sources of pollution in lakes were domestic sewage and industrial discharge. Notably, Hou Lake had the highest TN concentrations among the six surface water resources. Direct discharge of domestic sewage and dumping of animal and industrial waste in nearby areas was responsible for introducing a large quantity of N-containing pollutants (Table S5). Site HH 3 in Hou Lake had the maximum TN concentration, which was significantly higher than other sampling sites. It was probably related to nearby industrial and residential activities (Yang et al., 2009), which released a large amount of domestic sewage and aquaculture waste into the Hou Lake.
The N species differed significantly between rivers and lakes. For both rivers and lakes, DON and NO3 −-N were the most dominant N species that accounted for 0 to 86.2% and 0 to 93.6% of the TN, respectively. The NO3 −-N content in rivers varied from 0.4 to 1.4 mg N/L, and the proportion to TN ranged from 30.0% to 93.6%, which were much higher than in lakes. The results indicate that NO3 −-N was the most significant component of TN in rivers. Chen et al. (2019) also reported that dissolved inorganic N was the dominant N form in many rivers, and its amount was strongly linked to N input on land (e.g., the use of synthetic N fertilizer, manure N input, human excreta N discharge, biological fixation, atmospheric deposition). In spring, the primary source of N input in the Yangtze River was the synthetic N fertilizer, which might contain a lot of NO3 −-N (Chen et al., 2019). Besides, higher DO values in rivers were observed in this study. The nitrification could be highly promoted in rivers because of sufficient DO supply, facilitating NO3 −-N production (Yabusaki et al., 2017).
The DON concentrations in lakes were in the range of 0.3–4.0 mg N/L, which was higher DON than in rivers. Moreover, DON accounted for 53.0%–86.2% of the TN in all lakes, implying that DON was the dominant N form in these water bodies. Excessive DON in the surface water resources may deteriorate water quality in several ways. On the one hand, DON under oxic conditions can be further be transformed into NO3-N, aggravating NO3 −-N contamination in aquatic systems (de Vera et al., 2017). In this study, the measured DO values in lakes varied from 9.0 to 10.8 mg/L. Nitrification could occur in lakes because of sufficient DO supply, facilitating NO3 −-N contamination (Yabusaki et al., 2017). On the other hand, as N-enriched DOM, DON is regarded as the precursor for DBP formation (Gu et al., 2011). High DON content in lakes may increase DBP formation potential and threaten water quality.
The chemical properties of DON can affect its bioavailability and transformation in aquatic ecosystems (Carstea et al., 2019). To clarify the relationship between DON components and DBPs, understanding the composition of DON is essential. As is well-known, DON is the nitrogenous fraction of DOM. The structural and compositional characteristics of DON should be highly related to DOM. A254 and A253/A203 are crucial parameters to characterize the aromaticity of DOM (Li et al., 2014b). A higher A254 value indicates higher aromatic content in DOM. Conversely, a lower A254 value indicates lower aromaticity with more hydrophilic compounds. A higher A253/A203 ratio reflects that the substitution groups contain more aromatic rings. In this study, A254 and A253/A203 were analyzed and illustrated in Fig. 5 .
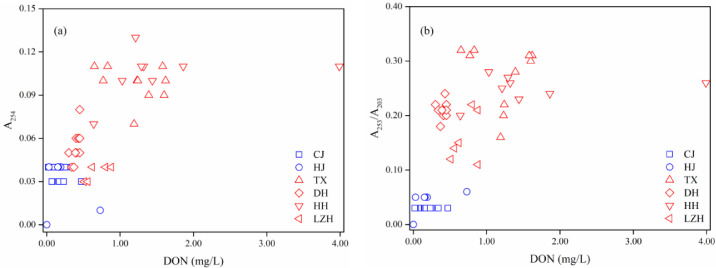
UV-vis optical spectrum. (a) A254 levels at the sampling sites. (b) A253/A203 ratios at the sampling sites. CJ: Yangtze River; HJ: Han River; TX: Tangxun Lake; DH: Dong lakes; HH: Hou Lake; LZH: Liangzi Lake.
The results showed that the A254 and A253/A203 ranged from 0–0.1 and 0–0.3, respectively. A significant difference was observed in the A254 and A253/A203 values of rivers and lakes. In general, the rivers had lower A254 and A253/A203 values compared to lakes. It indicated that DON in rivers with lower contents was made of more hydrophilic compounds. In contrast, DON in lakes with higher content contained more aromatic substances. The A254 values and A253/A203 ratios in the Hou Lake and Tangxun Lake were higher than those in East Lake and Liangzi Lake. Differences in the anthropogenic discharge into the lakes could explain the differences in the aromaticity levels of DOM (Lorite-Herrera et al., 2009; Nai et al., 2020). Notably, the values of A254 and A253/A203 at different sampling sites in the same water resource were nearly similar. It demonstrated that DON in the same water resource had similar constituents.
According to the results mentioned above, the contents and constitutes of DON in the same water resource did not differ significantly. Thus, we chose the sampling station with the highest DON content in each water resource to characterize the 3D-EEM spectra (Fig. 6 ). According to excitation and emission wavelength boundaries, the 3D-EEM spectra were divided into five areas (Jacquin et al., 2017; Zhang et al., 2020b). In summary, peaks at shorter emission wavelengths (< 380 nm) and shorter excitation wavelengths (< 250 nm) were attributed to region I and region II (PI and PII), indicating simple aromatic protein-like substances, such as tyrosine-like and tryptophan-like substances. Peaks at shorter excitation wavelengths (< 250 nm) and longer emission wavelengths (> 380 nm) were related to region III (PIII), representing fulvic acid-like compounds. Peaks in region IV (PIV), indicating soluble microbial product-like substances, occurred at shorter emission wavelengths (< 380 nm) and longer excitation (> 250 nm). Peaks of region V (PV) characterized by longer emission wavelengths (> 380 nm) and longer excitation wavelengths (> 250 nm) indicated humic acid-like compounds. The percent distribution of the five regions for DON based on the fluorescence peak characteristics has been presented in Table 1 .
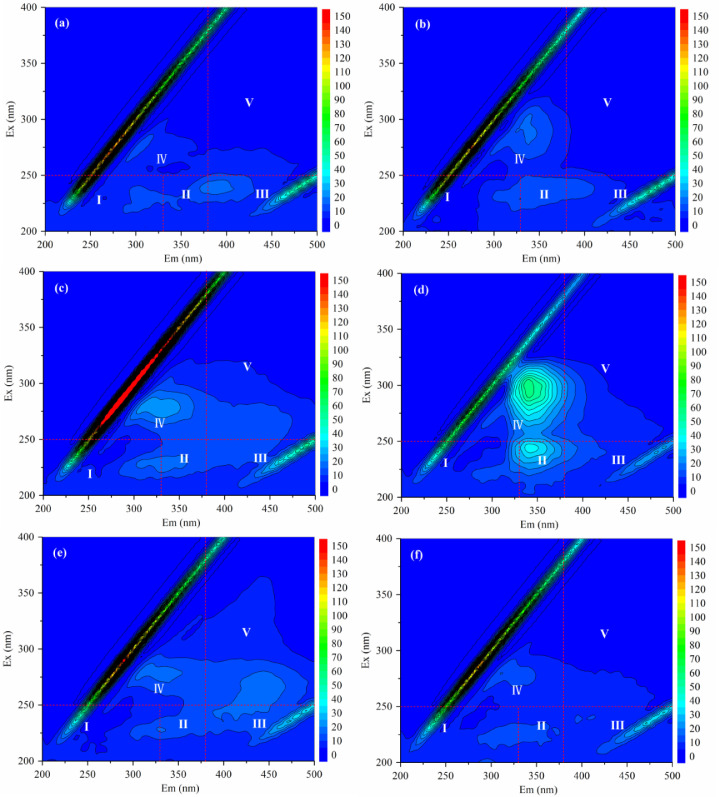
3D-EEM of surface water in Wuhan. (a) Yangtze River, (b) Han River, (c) Tangxun Lake, (d) Dong lakes, (e) Hou Lake, (f) Liangzi Lake.

| Sampling category | Location | Percentage distribution (%) | PIII+V/PI+II+IV | SUVA254 | ||||
|---|---|---|---|---|---|---|---|---|
| PI | PII | PIII | PIV | PV | ||||
| Rivers | Yangtze River | 22.3 | 28.5 | 30.5 | 12.3 | 6.4 | 0.6 | 1.6 |
| Han River | 19.8 | 33.6 | 26.8 | 16.0 | 3.9 | 0.4 | 0.3 | |
| Central urban lakes | Tangxun Lake | 17.3 | 27.7 | 25.4 | 18.9 | 10.7 | 0.6 | 1.7 |
| East Lake | 15.9 | 38.4 | 18.2 | 20.8 | 6.7 | 0.3 | 1.2 | |
| Northwest lake | Hou Lake | 15.3 | 25.8 | 27.1 | 16.6 | 15.3 | 0.7 | 1.1 |
| Southeast lake | Liangzi Lake | 22.1 | 28.8 | 27.1 | 15.0 | 7.0 | 0.5 | 1.0 |
DON in Wuhan surface water resources mainly comprised protein-like and fulvic acid-like substances with fewer soluble microbial product-like and humic acid-like compounds, reflected by its high PI+II+IV of 57.7%–75.1%. This suggested that microorganisms efficiently utilized the dominant component of DON in Wuhan's surface water resources. Notably, Tangxun Lake and Hou Lake had higher PIII+V than others.
In addition, PIII+V/PI+II+IV ratios of DON and SUVA254 were also calculated to reflect the humification degree (Table 1). The PIII+V/PI+II+IV ratios were 0.6 and 0.7 in Tangxun Lake and Hou Lake, which were higher than those in other water resources. The results illustrated that these two lakes had a higher humification degree of DON with higher contents of the humic and fulvic materials. This result was in agreement with the A254 and A253/A203 results reported in the study. Additionally, the SUVA254 values of rivers and lakes varied from 0.3 to 1.6 L/(mg m) and 1.0 to 1.7 L/(mg m), respectively. Overall, the SUVA254 values for DON in different surface water resources were significantly lower than 3.0 L/(mg m), illustrating that DON in the surface water mainly comprised hydrophilic substances (Zhang et al., 2020c).
Due to the observation of DON in surface waters, we speculated that the extensive use of disinfectants during the COVID-19 pandemic might lead to the increased production of DBPs. Thus, the sampling site with the highest DON content in each water resource was selected to investigate the distribution of DBPs. Fig. 7 showed the three typical speciations of DBPs in different surface water resources. The concentrations of THMs, HANs, and N-nitrosamines varied from 0.5 to 6.8 μg/L (average 2.2 μg/L), 0 to 0.1 μg/L (average 0.02 μg/L), 23.1 to 97.4 ng/L (average 60.8 ng/L), respectively. THMs, HANs and N-nitrosamines contributed up to 90.0%–98.5%, 0%–1.8% and 1.0%–10.0% to the total DBPs. THMs were the most abundant DBPs, followed by N-nitrosamines and HANs. DBCM (average 1.2 μg/L) and TCM (average 1.0 μg/L) were the key THMs species, while TCAN (average 0.02 μg/L) was the dominant HANs species. In this study, NDMA (average 25.8 ng/L), accounting for 10.4%–83.8%, was the dominant species among the seven measured N-nitrosamines. China regulates the levels of some of the DBPs in centralized surface water resources. For instance, the regulatory standards for TCM and TBM are 60 and 100 μg/L, respectively (Zhou et al., 2019). In this study, TCM and TBM concentrations complied with the standards even after the COVID-19 pandemic. Notably, most countries, including China, have not developed guidelines to limit DBPs in surface water (Kristiana et al., 2017).
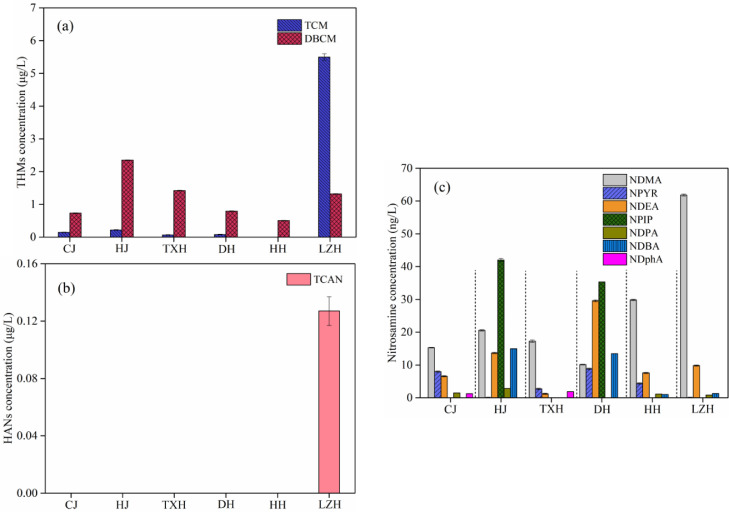
DBP distribution in Wuhan surface water resources. CJ: Yangtze River; HJ: Han River; TX: Tangxun Lake; DH: Dong lakes; HH: Hou Lake; LZH: Liangzi Lake.
Until now, the levels of DBPs in drinking water have garnered attention, while their occurrence in natural water bodies has been assumed to be insignificant. The current understanding of the DBP distribution in China's surface water is highly inadequate. To address this knowledge gap, we gathered the observation data on the concentrations of DBPs in surface water in China from published reports (Table S7). Data from previous research showed that DBP concentrations in surface water remained steady at a very low level before the COVID-19 pandemic. The levels of most DBPs after the COVID-19 pandemic were within the range of data previously reported, while some DBPs were higher than the reported data. For example, previous studies showed that the total nitrosamines concentration in rivers was in the range of 1.6–62.4 ng/L. A recent study reported that the mean concentration of N-nitrosamines in the surface water was 29.2 ng/L after COVID-19, which was not higher than the reported data (Li et al., 2021). In contrast, the concentration of N-nitrosamines varied from 23.1 to 97.4 ng/L in the current study. Increased levels of N-nitrosamines may be associated with the elevated use of disinfectants during the COVID-19 pandemic. Increased N-nitrosamines could come from two sources. (1) Wastewater treatment plant effluents and industrial/domestic wastewaters containing N-nitrosamines may directly be discharged into the surface water (Wang et al., 2016). (2) N-nitrosamines could be generated when the surface water received residual chlorine. Although most DBPs did not increase significantly in surface water after the COVID-19 pandemic, their potential health risks in surface water can not be overlooked.
In order to elucidate the effects of compositional characteristics of DON on DBP formation, the relationships among DON-related indices (DOC, DON, A203, A253, A254, A253/A203, SUVA254, PIII+V/PI+II+IV, PI, PII, PIII, PIV, and PV), primary water quality parameters (TOCl, and TOBr) and different types of DBP contents were determined (Fig. 8 ). Spearman's rank correlation illustrated that TOCl was strongly positively correlated with some N-nitrosamines (including NDPA and NDphA) (r = -0.7, p < 0.05; r = 0.7, p < 0.05), suggesting that TOCl participated in oxidation reactions in the presence of DON (Beita-Sandí et al., 2020).
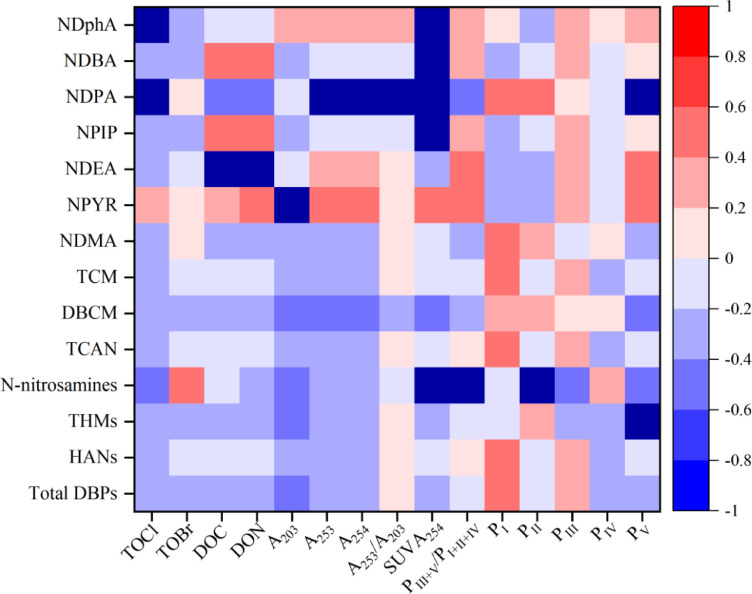
Spearman's rank correlations among the levels of DBPs, DON related indices and physicochemical characteristics.
Some N-nitrosamines (NDEA) showed significantly positive correlations with DON (r = 0.8, p < 0.05), suggesting that higher DON contents generated higher amounts of NDEA. This result demonstrated that DON served as a crucial NDEA precursor, which agreed with reported studies (Chang et al., 2013; Hua et al., 2020). With regard to optical properties, SUVA254 exhibited strong negative correlations with total N-nitrosamines and some specific species of N-nitrosamines (including NPIP, NDPA, and NDBA) (r = -0.7, p < 0.05; r = -0.7, p < 0.05; r = -0.8, p < 0.05; r = -0.8, p < 0.05). The results implied that hydrophilic substances with low SUVA254 values could be precursors for NPIP, NDPA, NDBA or total N-nitrosamines. Further, THMs showed a significant positive with PV (humic acid-like components) (r = 0.7, p < 0.05), indicating that the humidified DON was a dominant THMs precursor.
Unexpectedly, total N-nitrosamines had no significant relationship with DON but had a strong positive correlation with PⅡ (protein-like substances) (r = 0.9, p < 0.05). This suggested that DON fraction containing more protein-like components favored the formation of N-nitrosamines. Krasner et al. (2013) has proposed that amine precursor is the dominant mechanism responsible for the formation of nitrosamines. For protein-like fraction, amines, carboxylic and aliphatic structures are considered as basic fluorescent units (Chen et al., 2015; Li et al., 2014a; Liu et al., 2017). In this study, the amines structures in the protein-like components may serve as N-nitrosamines precursors.
Overall, the key factor influencing the occurrence of THMs in surface water was humificated DON. On the other hand, amines in DON played a vital role in forming N-nitrosamines. Some DON components exhibited significant relationships with DBPs and can serve as effective indicators to track DBP formation. It was worth noting that no significant association was detected between some DBPs and DON components in the present study. This may be because of the following two reasons: 1) Some DBPs in surface water might have been directly discharged from sewage treatment plants. 2) The physical conditions (e.g., pH, temperature, ionic strength) in surface water environment may influence the DBP formation.
Undoubtedly, COVID-19 will have a long-lasting impact on the environment, highlighting the need for new research perspectives and policy needs. This study confirmed that the presence of DON in surface water could result in DBP formation, especially N-nitrosamines, when disinfectants were discharged into surface water during the COVID-19 pandemic. This study highlights that DON contamination in surface water indeed increased DBP formation, threatening water quality. Routine assessment of surface water quality should include DON and DBPs as the necessary parameters, especially for formulating effective policies during COVID-19.
During the COVID-19 pandemic, the use of chlorine-based disinfectants was elevated for eliminating pathogens in contaminated environments. Residual disinfectants may enter natural water bodies and facilitate DBP formation depending on the availability of DON. Results showed that a significant correlation between DON components and DBPs, highlighting that DON can serve as effective indicators to track DBP formation. Humificated DON was a crucial precursor for THMs formation, while the amines structures in DON played a vital role in forming N-nitrosamines. This study highlights that DON contamination in surface water indeed increased DBP formation, threatening water quality. Routine assessment of surface water quality should include DON and DBPs as the necessary parameters, especially for formulating effective policies during COVID-19.
| TOCl | TOBr | DOC | DON | A203 | A253 | A254 | A253/A203 | SUVA254 | PIII+V/PI+II+IV | PI | PII | PIII | PIV | PV | |
|---|---|---|---|---|---|---|---|---|---|---|---|---|---|---|---|
| Total DBPs | -0.4 | -0.3 | -0.3 | -0.3 | -0.5 | -0.4 | -0.4 | 0.0 | -0.3 | -0.2 | 0.6 | -0.1 | 0.2 | -0.3 | -0.3 |
| HANs | -0.3 | -0.2 | -0.2 | -0.2 | -0.4 | -0.3 | -0.3 | 0.1 | -0.1 | 0.0 | 0.5 | -0.2 | 0.2 | -0.3 | -0.2 |
| THMs | -0.4 | -0.3 | -0.3 | -0.3 | -0.5 | -0.4 | -0.4 | 0.0 | -0.3 | -0.2 | -0.1 | 0.2 | -0.3 | -0.3 | 0.7* |
| N-nitrosamines | -0.5 | 0.6 | -0.2 | -0.4 | -0.5 | -0.4 | -0.4 | -0.2 | -0.7* | -0.8* | -0.1 | 0.9* | -0.6 | 0.3 | -0.6 |
| TCAN | -0.3 | -0.2 | -0.2 | -0.2 | -0.4 | -0.3 | -0.3 | 0.1 | -0.1 | 0.0 | 0.5 | -0.2 | 0.2 | -0.3 | -0.2 |
| DBCM | -0.3 | -0.3 | -0.3 | -0.4 | -0.5 | -0.6 | -0.6 | -0.3 | -0.6 | -0.4 | 0.3 | 0.2 | 0.1 | 0.0 | -0.6 |
| TCM | -0.4 | -0.2 | -0.2 | -0.2 | -0.4 | -0.3 | -0.3 | 0.1 | -0.2 | -0.1 | 0.6 | -0.2 | 0.2 | -0.3 | -0.2 |
| NDMA | -0.3 | 0.1 | -0.3 | -0.4 | -0.4 | -0.3 | -0.3 | 0.1 | -0.2 | -0.4 | 0.5 | 0.2 | -0.1 | 0.0 | -0.4 |
| NPYR | 0.2 | 0.0 | 0.3 | 0.5 | 0.7* | 0.5 | 0.5 | 0.0 | 0.5 | 0.6 | -0.3 | -0.4 | 0.2 | -0.2 | 0.6 |
| NDEA | -0.4 | -0.2 | 0.8* | 0.8* | -0.1 | 0.2 | 0.2 | 0.1 | -0.4 | 0.5 | -0.4 | -0.3 | 0.2 | -0.1 | 0.5 |
| NPIP | -0.4 | -0.3 | 0.5 | 0.5 | -0.3 | -0.1 | -0.1 | -0.2 | -0.7* | 0.2 | -0.3 | -0.1 | 0.2 | -0.1 | 0.1 |
| NDPA | -0.7* | 0.0 | -0.5 | -0.6 | -0.2 | -0.9* | -0.9* | -0.7* | -0.8* | -0.6 | 0.4 | 0.5 | 0.0 | -0.2 | -0.8* |
| NDBA | -0.4 | -0.3 | 0.6 | 0.5 | -0.3 | -0.1 | -0.1 | -0.2 | -0.8* | 0.2 | -0.3 | -0.1 | 0.2 | -0.1 | 0.1 |
| NDphA | 0.7* | -0.3 | -0.2 | -0.1 | 0.3 | 0.3 | 0.3 | 0.2 | 0.7* | 0.2 | 0.0 | -0.4 | 0.2 | 0.0 | 0.2 |
⁎ Correlation is significant at the 0.05 level (2-tailed).
The authors declare that they have no known competing financial interests or personal relationships that could have appeared to influence the work reported in this paper.
This study was supported by the Ministry of Science and Technology, the National Natural Science Foundation of China (52091543) and the Chinese Academy of Engineering (2020-ZD-15).
 Spatial variation of dissolved organic nitrogen in Wuhan surface waters: Correlation with the occurrence of disinfection byproducts during the COVID-19 pandemic
 Facebook
 Twitter
 Linkedin
 Whatsapp
