
These authors contributed equally to the study.
Senile osteoporosis (SOP) is widely regarded as one of the typical aging-related diseases due to a decrease in bone mass and the destruction in microarchitecture. The inhibition of mitophagy can promote bone marrow mesenchymal stem cells (BMSCs) senescence, and increasing studies have shown that interventions targeting BMSCs senescence can ameliorate osteoporosis, exhibiting their potential for use as therapeutic strategies. Sirtuin-3 (Sirt3) is an essential mitochondria metabolic regulatory enzyme that plays an important role in mitochondrial homeostasis, but its role in bone homeostasis remains largely unknown. This study seeks to investigate whether advanced glycation end products (AGEs) accumulation aggravated BMSCs senescence and SOP, and explored the mechanisms underlying these effects. We observed that AGEs significantly aggravated BMSCs senescence, as well as promoted mitochondrial dysfunction and inhibited mitophagy in a concentration-dependent manner. In addition, this effect could be further strengthened by Sirt3 silencing. Importantly, we identified that the reduction of Sirt3 expression and the mitophagy were vital mechanisms in AGEs-induced BMSCs senescence. Furthermore, overexpression of Sirt3 by intravenously injection with recombinant adeno-associated virus 9 carrying Sirt3 plasmids (rAAV-Sirt3) significantly alleviated BMSCs senescence and the formation of SOP in SAMP6. In conclusion, our data demonstrated that Sirt3 protects against AGEs-induced BMSCs senescence and SOP. Targeting Sirt3 to improve mitophagy may represent a potential therapeutic strategy for attenuating AGEs-associated SOP.
Osteoporosis is characterized by a decrease in bone mass and the destruction in microarchitecture resulting in an increased propensity of fracture [1,2]. Aging is a multi-factorial process featured by a continuous loss of physiological function and biological mechanism, giving rise to enhanced vulnerability toward infections [3]. Senile osteoporosis (SOP) is age-related bone loss and a specific biological ageing in the skeletal system, generally refers to the osteoporosis after the age of 70. By 2050, the proportion of people aged 60 years or over in the total population will reach 22% worldwide [4]. With the increase of the aging population, SOP and related fractures not only distinctly augment the morbidity and mortality of elderly individuals, but also dramatically aggravate the financial burden of public health. However, the pathogenesis of SOP has not been fully clarified, and there is still a lack of effective prevention and treatment measures.
Advanced glycation end products (AGEs), as the end products of glycation reactions, involved in the pathogenesis of aging-related diseases. The formation of AGEs, typical resulting from Maillard reaction or non-enzymatic glycation process, has been known to be irreversible and its accumulation could lead to the dysfunction of macromolecules such as nucleic acids, lipids and proteins [5]. Increasing evidence demonstrated that AGEs, accumulated with advancing age, dramatically decreased bone density and mineralization [6]. Further research confirmed that AGEs play a significant role in the impaired bone formation through triggering inflammation and bone loss in the pathogenesis of osteoporosis [7].
As one of highly conserved nicotinamide adenine dinucleotide (NAD+)-dependent histone deacetylases, sirtuins (Sirts) regulate numerous physiological and pathological of processes, such as gene expression, apoptosis, inflammation and healthy aging. There are seven members in Sirts protein family, which located in different subcellular regions [8]. More recent studies have shown that targeting proteins belonging to the sirtuin family can significantly delay the occurrence and development of ageing process and many age-related chronic diseases [9]. Sirt3, a human Sir2 homologue, translocate to the mitochondria under cellular stress. It is known to serve an important role in mitochondria, mediating mitochondrial dynamics and other key biological processes of mitochondrial quality control [10]. Brown et al. reported that the inhibition of Sirt3-mediated mitochondrial homeostasis involved in enhanced oxidative stress in aged stem cells (SCs). The study proved that Sirt3 could reverse the aging-associated degeneration when compared the quantity and quality of SCs in wild-type and Sirt3 knockout mice [11]. From our previous studies, the accumulation of AGEs in nucleus pulposus tissues contributed largely to intervertebral disc degeneration, induced an oxidative microenvironment and mitochondrial dysfunction [12]. Nevertheless, very little is known about the potential role of Sirt3 in the regulation of mitochondrial function in osteoporosis.
Mitophagy, the selective degradation of mitochondria by autophagy, maintains cell homeostasis and ensure mitochondrial homeostasis via specifically degrading damaged mitochondria [13]. There is growing evidence that mitophagy is reportedly closely related with aging and age-related diseases, which impairs mitochondrial quality and function [14]. Mitophagy is a normal physiological activity that occurs under healthy conditions, whereas it can also be altered under pathological conditions, or specific physiological conditions to promote the occurrence of aging-related diseases [15]. Recent evidence indicated that abnormal mitophagy play a key role in bone metabolism disorders, the maintenance and differentiation of stem cell [16,17].
The senescence of bone marrow mesenchymal stem cells (BMSCs) plays an important role in the occurrence and development of osteoporosis. The “osteogenesis-adipogenesis” differentiation balance of bone marrow mesenchymal stem cells is essential for the maintenance of healthy bone homeostasis [18]. Some studies have reported that the intrinsic properties of BMSCs such as senescence, osteogenic and adipogenic differentiation potential were markedly changed during aging process [19,20]. Therefore, it is an important research focus to enhance the osteogenic differentiation of BMSCs and improve their osteogenic efficiency through anti-aging of BMSCs.
Based on the preliminary work, Sirt3 are involved in regulating mitochondrial homeostasis and mitophagy, we hypothesized that AGEs might affect mitochondrial homeostasis by interfering with Sirt3 and tried to assess the association between mitophagy and AGEs. Thus, we investigated the potential role of AGEs and Sirt3 on SOP in vitro and in vivo, the involved downstream signaling pathways were also investigated. We used a well-established animal model of SAMP6 and overexpressed Sirt3 by a recombinant adeno-associated viral (rAAV) vector transfection, exploring the role of Sirt3 on AGEs-induced cell senescence and SOP. Our investigations shed a new light on mechanism of the pathogenesis and targeting Sirt3 offer a novel therapeutic intervention strategy against SOP.
In vitro experiments. BMSCs were exposed to the same volume of phosphate-buffered saline (PBS), bovine serum albumin (BSA, Abcam, Cambridge, UK) (100 μg/mL), AGEs (50, 100 or 200 μg/mL buffered using PBS; Abcam, Cambridge, UK).
Experiment related to mitophagy. The experiments were divided into six groups: BSA + vehicle, BSA + carbonyl cyanide m‐chlorophenyl hydrazone (CCCP), BSA + cyclosporin A (CsA), AGEs + vehicle, AGEs + CCCP (10μM), AGEs + CsA (5μM).
Osteogenic differentiation. To evaluate the osteogenic differentiation, the experiments were divided into six groups: BSA + vehicle + Osteogenic induce supplements, BSA + CCCP + Osteogenic induce supplements, BSA + CsA + Osteogenic induce supplements, AGEs + vehicle + Osteogenic induce supplements, AGEs + CCCP (10μM) + Osteogenic induce supplements, AGEs + CsA (5μM) + Osteogenic induce supplements.
Adult ICR mice were purchased from the Beijing Vital River Laboratory Animal Technology Co., China. The senescence-accelerated mouse strain P6 (SAMP6), as a clinically relevant model of SOP, is characterized by rapid aging and shortened lifespan. We adapted the SAMP1 mice as control mice. SAMP1 were also purchased from Beijing Vital River Laboratory Animal Technology Co., China. All mice were raised in specific pathogen-free (SPF) condition and maintained at 25 ± 1 °C and 60% ± 10% humidity under a 12-h light/dark cycle during the experiments. All animals were treated according to the regulations of Chinese law and the local Ethical Committee.
BMSCs were harvested from 2-month-old ICR mice and the 6-month-old SAMP6 mice according to the detailed procedures in previously study [21]. Generally, bone marrow was isolated aseptically by flushing the femurs and tibias of mice and then suspended in DMEM low glucose (Hyclone) supplemented with 10% FBS (Gibico) in a humidified atmosphere incubator (Thermo) containing 95% air and 5% CO2 at 37∘C. Non-adherent cells were removed and medium was changed after 3 days. Medium was changed every 2 days and cells were passaged to employ in the further experiments.
The BMSCs were plated in 96-well plates (1 × 10⁴cells/mL, 100μL per well) and grown overnight. The cells were treated according to the above-mentioned experimental groups. 20 μL of CCK-8 solution (BeyoTime Biotechnology, C0038, Shanghai, China) was added to each well at the 24 h, 48 h and 72h and then incubated the plates for 4 h in the incubator. The OD value were determined at 450 nm by a microplate reader (Thermo, MK3, USA) and the cell viability was assessed by the following equation.
The BMSCs were plated in 6-well plates (1 × 10⁵ cells/mL, 2 mL per well). Treated according to the above-mentioned experimental groups and cultured for 24 h, 48 h, 72 h or 96 h (at 37 °C, 5% CO2). After 24 h, 48 h and 72 h, the cells were collected for cell cycle assay using the Cell Cycle and Apoptosis Analysis Kit (BeyoTime Biotechnology, C1052, Shanghai, China) according to the manufacturer’s protocol. Cytometric analysis was carried out by means of a flow cytometer (BD-FACSVerse, BD Bioscience, USA).
After treated with 24 h, 48 h and 72 h, the BMSCs were collected for the quantification of β-galactosidase activity and then fixed with 4% formaldehyde (Rich joint, Shanghai). The senescence-associated β-galactosidase staining assay was carried out using a Senescence β-Galactosidase Staining Kit (BeyoTime Biotechnology, C0602, Shanghai, China) based on a protocol published by manufacturer.
The BMSCs were treated with different group as mentioned above, then the cells were washed with ice-cold PBS and fixed with 4% paraformaldehyde for 15–30 min. Subsequently, the cells were treated with 0.1% Triton (Rich joint, Shanghai) for 15 min to permeate cell membranes. After washing twice with PBS, the cells were blocked for 15 min with PBS containing 5% FBS overnight at 4 °C. The cells were incubated overnight at 4°C with mouse monoclonal anti-γ-H2AX Ser139 (Abcam, ab176916, diluted 1:100) or anti-H3K9me3 (Abcam, ab176916), and then incubated with Cy3-coupled secondary antibody (Proteintech, SA00009-2, Beijing, China). The final step was to stain nuclei with Hoechst 33258 (Beyotime Biotechnology, C1052, Shanghai, China) 15 min at room temperature without exposure to light. The images ware observed through fluorescence microscope (IX71, Olympus Corporation, Tokyo, Japan).
The BMSCs were lysed in pre-cooled RIPA buffer containing protease inhibitor cocktail. Proteins were separated through 10% sodium dodecyl sulfate-polyacrylamide gel electrophoresis (SDS-PAGE) (SINOPHARM, 30166428, Shanghai), and then transferred to PVDF membranes (Millipore, HATF00010, Bradford, MA, USA). After blocking with 4% non-fat milk, the membranes were incubated with the primary antibodies P16 (1:1000; Catalog No.AF5484; Affinity Biosciences), P21 (1:1000; Catalog No.AF6290; Affinity Biosciences), P53 (1:1000; Catalog No.AF0879; Affinity Biosciences), LC3B (1:1000; Catalog No. AF4650; Affinity Biosciences), P62 (1:1000; Catalog No.AF5384; Affinity Biosciences), Parkin (1:1000; Catalog No.AF0235; Affinity Biosciences), Sirt3 (1:1000; Catalog No.AF5135; Affinity Biosciences), GAPDH (1:1000; Catalog No. AF7021; Affinity Biosciences) overnight at 4 °C and then incubated for 1 h at 37 °C with secondary antibodies (1:10,000; Beyotime Biotechnology; cat. no. A0208). The membranes were treated with ECL (Dingguo Changsheng Biotechnology, Beijing, China) and developed with detection system, then exposed onto films (ChemiScope 5300, CLINX, Shanghai, China).
RNA extraction and cDNA synthesis: Total RNA was extracted from BMSCs using TRIzol reagent (Invitrogen) and used for the synthesis of first-strand cDNAs by Revert Aid first-strand cDNA synthesis kit (Thermo Scientific). cDNA was subjected to Quantitative PCR analysis. Quantitative PCR: qPCR was performed using an ABI PRISM 7700 sequence detection system and SYBR Green qPCR kit (TOYOBO, Osaka, Japan) (See Table 1). Expression levels were normalized to GAPDH.

| Description of prime | Sequence of prime |
|---|---|
| Nanog (mouse)-RT-F | CCCTGATTCTTCTACCAGTCCCA |
| Nanog (mouse)-RT-R | CACAGTCCGCATCTTCTGCTTCC |
| Oct-4 (mouse)-RT-F | CAGAAGGAGCTAGAACAGTTTGCC |
| Oct-4 (mouse)-RT-R | CGCCTACATTAAGAGCCGTGAGAT |
| GAPDH (mouse)-RT-F | GGTGAAGGTCGGTGTGAACG |
| GAPDH (mouse)-RT-R | CTCGCTCCTGGAAGATGGTG |
| Sirt3 (mouse)-RT-F | GCCCAATGTCACTCACTACTTCCTG |
| Sirt3 (mouse)-RT-R | TCCCAGATGCTCTCTCAAGCCCGTC |
Briefly, the BMSCs (1 × 10⁵/well) were cultured in 6-well culture plates and incubated with different treatments. The cells were lysed to determine total cellular ATP using an ATP detection kit (Solarbio, BC0300, Beijing, China). On the basis of manufacturer’s instructions, ATP was extracted from the BMSCs and measured using a UV spectrophotometer (Beckman Coulter DU720, California, USA).
The BMSCs were divide into various groups as mentioned above and incubated with different treatments for 72h to observe the antioxidant properties. We selected 2′, 7′-Dichlorodihydrofluorescein diacetates (DCFH-DA) (Beyotime Biotechnology, S0033 M, Shanghai, China) as a useful mitochondrial superoxide indicator of ROS. DCFH-DA was dissolved in serum-free medium (1:1000 dilution) and diluted to a final concentration of 10 μmol/L. The cells resuspended in diluted DCFH-DA and kept at a concentration of 100 × 105 to 2000 × 105 cells/mL in the cell incubator for 72 h. Mixed by inversion every 5 min to ensure full contact of the probe with the cells. We also adapted Mito-SOX Red (Invitrogen, M36008, USA) to determine mitochondrial superoxide and Mito-tracker Green (Beyotime Biotechnology, C1048, Shanghai, China) as a mitochondrial-selective fluorescent label. 5 μmol/L Mito-SOX and 100 nmol/L Mito-tracker Green was added to each group and incubated for 30 min in the dark (37°C and 5% CO2). Washed the cells with serum-free medium three times. DAPI was used for nuclear localization and the results were observed by a microscope(OLYMPUS, IX71, Japan).
The lipophilic cationic probe 5, 5′, 6, 6′‐tetrachloro‐1, 1′, 3, 3′‐tetraethyl‐imida‐carbocyanine iodide (JC‐1) was applied to detect the mitochondrial membrane potential. After experimentation, 2 μM of JC-1 (Beyotime Biotechnology, S0033 M, Shanghai, China) was added to the cells and the cells were incubated for 30 min at 37°C in the dark. After washing the cells three times with PBS, the nuclei were stained with Hochest 33258. The results were observed by fluorescence microscope.
Mitophagy in BMSCs was analyzed using the Mitophagy detection kit (Dojindo, MD0, Kumamoto, Japan). 100 nmol/L Mtphagy Dye (containing 100 nmol/L Mito-tracker Green Probe) was added to each group and the cells were incubated for 30 min. After experimentation, the cells were washed twice with Hank’s. The results were observed by fluorescence microscope.
BMSCs were plated in 24-well plates (1 × 10⁵ cells/ml, 500 μL per well). When the cells grew to 90%, the medium replaced with the osteogenic differentiation medium, which contains 5 μg/ml insulin, 100 nM dexamethasone, 10 mM sodium β-glycerophosphate and 0.2 mM vitamin C in DMEM with 10% FBS. Treated in group as described above. Medicated medium was changed every 3 days and differentiation was induced up to 21 days.
After 21 days of induction, differentiated samples were collected to test ALP activity. ALP activity was assayed according to an alkaline phosphatase assay kit (Solarbio, BC2145, Beijing, China). On basis of the manufacturer’s instructions, we selected p-nitrophenylphosphate as the substrate to measure the ALP activity.
Calcium depositions were stained with alizarin red staining. After 21 days of differentiation, the cells were fixed with 70% ethanol and then added 300 μL 1% alizarin red (pH = 4.2) to each well. The plates were incubated at room temperature for 30 min and deionized water was added to stop the reaction. The results were observed by microscope.
After 15 days of differentiation, BMSCs were fixed with 10% neutral formaldehyde and stained with ORO for 1 h in the dark. The images were observed by microscope.
To silence Sirt3 expression, BMSCs were transfected with scrambled siRNA (30 nM) or Sirt3 siRNA (30 nM) (Guangzhou RiboBio, China) for 48 h using Hiperfect Transfection Reagent (Qiagen; cat. no. 301705) according to the manufacturer’s instructions and immediately stimulated with PBS or AGEs.
All studies involving animals are reported in accordance with the ARRIVE guidelines for reporting experiments involving animals [22]. A total of 40 animals described were used in the experiments. The SAMP6 mice (8 weeks) were fed a standard diet for 12 weeks and then were randomly assigned to 2 groups, adeno-associated virus-9 (AAV9)-EGFP (enhanced green fluorescent protein) control group (n = 20) and AAV9-EGFP-Sirt3 group (n = 20). AAV9 vectors were recombined with EGFP, or Sirt3 coding sequence [23]. All virus vectors were designed and constructed by Vigene Biosciences (Rockville, MD). Each mouse was received a tail vein injection (i.v.) of rAAV, 5 x 10¹¹ vg/mouse, once. Four weeks after AAV9-EGFP-control and AAV9-EGFP-Sirt3 injection, SAMP6 were randomly divided into BSA group (50 μg/mouse per 2 weeks, i.v., n = 10) and AGEs group (50 μg/mouse per 2 weeks, i.v., n = 10). After treatment BSA or AGEs for 12 weeks, the samples were collected after euthanasia.
The trabecular microstructure and a 3D image of left femur was analyzed using the Locus SP Micro-CT System (Skyscan, N.V., Belgium) provided by the servicebio technology CO., LTD. Samples were set in the sample holder of the scanner and scans were made along the longitudinal axis of the specimen. Micro-CT images were captured consecutively. The image size was set at 1024 × 1024 pixels with a pixel size of 25 μm × 25 μm and a distance of 25 μm between sections. Scans were made using the scanning parameters: 50 kV, 400 μA, and a 40 min scan period for each specimen. For better analysis the image and quantitative calculations, the images were reconstructed and processed at a spatial resolution of 10 μm, using circular scanning.
The bone-specific alkaline phosphatase (BALP) and tartrate-resistant acid phosphatase 5b (TRAP-5b) levels in the serum were measured using ELISA kits (Elabscience). The test was performed by using the manufacturer's protocol.
After 4 weeks of infection with the adeno-associated virus with the Sirt3 plasmid, we performed live imaging under the condition of anesthesia with isoflurane to observe the expression of GFP fluorescence. The fluorescence was measured by an IVIS Imaging System 200 (Caliper Life Sciences) using γex = 550 nm an dγem = 570 nm. The images were quantified for fluorescent radiant efficiency [fluorescence emission radiance per incident excitation intensity: (p/s/cm2/sr)/(lW/cm2)] using region-of-interest (ROI) function of the Living Image 4.3.1. software.
Differences between different groups were performed using Student's t-test (SPSS Statistical Software). P values of <0.05 were considered significant.
AGEs have been shown to be critical mediators both in the pathogenesis of osteoporosis and other chronic degenerative diseases related to ageing [24]. In this study, we first detected the effect of different concentrations of AGEs on the senescence of BMSCs. It is well known that β-galactosidase (SA-β-gal) is a metabolic marker of senescence, as it is a key lysosomal enzyme which accumulates in lysosomes and autophagosomes in senescent cells [25]. We performed a senescence-associated SA-β-gal assay in order to investigate cellular senescence. As shown in Fig. 1A, when the BMSCs were treated with 50 μg/mL, 100 μg/mL, 200 μg/mL AGEs for 24 h, 48 h and 72 h, AGEs significantly accelerated senescence of BMSCs in concentration-dependent manner. In addition, as shown in Fig. 1B and C, the expression of H3K9me3 and γ-H2AX, which are signs of aging damage, also enhanced with the increase of the concentration of AGEs. Aging-related genes, such as P16, P21 and P53, are well-established senescence markers. The overexpression of P16, P21 and P53 have previously shown to cause premature cell senescence [26,27]. Our results showed that the expressions of P16, P21 and P53 were strengthened with rising concentrations of AGEs and longer treatment durations (Fig. 1D–I). Furthermore, we further studied the effects of AGEs on the proliferation and cell stemness of BMSCs. Different concentrations of AGEs inhibited the proliferation of BMSCs (Fig. S1A). Oct4 and Nanog are transcription factors all essential to maintaining the stem cell phenotype. Different concentrations of AGEs reduced the mRNA levels of Oct4 and Nanog in a dose-dependent manner, indicating that AGEs damaged the stemness of stem cells (Figs. S1B and C). Those results indicated that AGEs accelerated cell senescence in BMSCs.

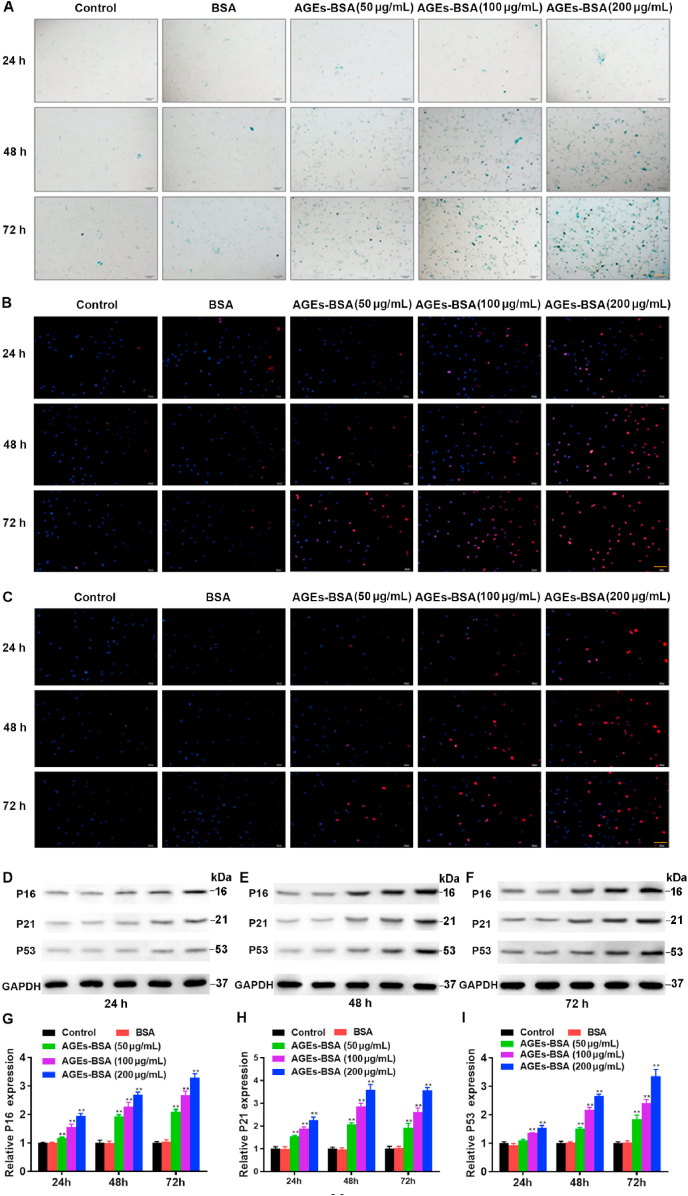
Effects of AGEs in different concentrations on the senescence of BMSCs. The BMSCs were treated with AGEs (50–200 μg/mL) or BSA for 24–72 h. (A) SA-β-gal assay for detection of BMSCs senescence. Scale bar: 100 μm. (B) Detection of H3K9me3 by immunofluorescence in BMSCs. Scale bar: 100 μm. (C) Detection of γ-H2AX by immunofluorescence in BMSCs. Scale bar: 100 μm. (D–I) Representative Western blotting assay and quantitation of the level of P16, P21, P53. **p < 0.01 versus BSA.
Senescent cells are characterized by dramatic changes in mitochondrial function, metabolism and homeostasis [28]. Accumulating evidence has demonstrated that mitochondrial dysfunction and mitophagy contribute to senescence [29]. As mentioned above, AGEs promote cell senescence, which is closely related to mitochondrial function and mitophagy. Mitochondrial function is prevailingly affected by intracellular ROS and mitochondrial membrane potential [30]. In our study, we firstly analyzed the effect of AGEs on mitochondrial function. To measure mitochondrial function, we examined the total intracellular ROS levels by DCF-DA assay (Fig. 2A). Given that ROS derive predominantly from mitochondria, we further used Mito-SOX assays to detect mitochondrial ROS (Fig. 2B). ROS staining showed that the DCF-DA (green) and Mito-SOX (red) fluorescent level gradually augmented with the increase in AGEs concentration in BMSCs. In other words, with an increase of the AGEs concentration, the production of mitochondrial ROS was gradually enhanced. Mitochondrial membrane potential is another critical indicator of mitochondrial function, and decreased mitochondrial membrane potential is closely associated with elevated mitochondrial ROS production [31]. In this experiment, ATP levels were measured by ATP determination kit. AGE treatment concentration-dependently reduced the ATP content of BMSCs (Fig. S2). In addition, mitochondrial membrane potential (MMP) was detected by JC-1staining, a fluorescent dye, which shows red fluorescence under aggregation conditions in normal mitochondria, but shows green fluorescence when the mitochondrial membrane potential decreases. The green fluorescence was increased and the red fluorescence was decreased with increasing AGEs concentrations (Fig. 2C). The shift from red to green fluorescence is thus an indicator for the decrease in the mitochondrial membrane potential.
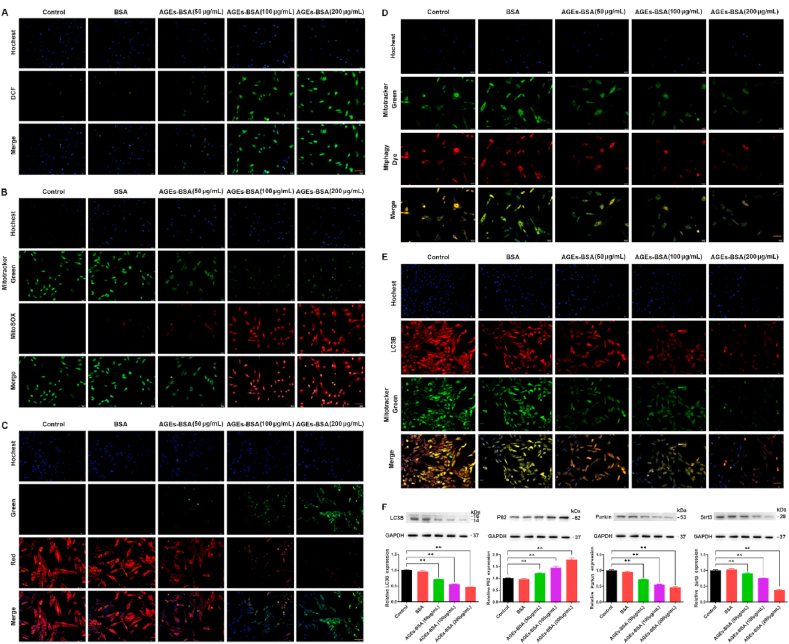
Effects of different concentrations of AGEs on mitochondrial function and mitophagy of BMSCs. The BMSCs were treated with AGEs (50–200 μg/mL) or BSA for 24–72 h. (A) Representative fluorescence images with DCF (green) staining in BMSCs stimulated with AGEs. Scale bar: 50 μm. (B) Representative fluorescence images with Mito-SOX (red) and Mito-Tracker (green) double-staining in BMSCs stimulated with AGEs. Scale bar: 50 μm. (C) The MMP was detected through JC-1 staining in BMSCs stimulated with AGEs. Scale bar: 50 μm. (D) Representative fluorescence images with Mtphagy Dye (red) and Mito-Tracker (green) double-staining in BMSCs stimulated with AGEs. Scale bar: 50 μm. (E) Representative fluorescence images with LC3B (red) and Mito-Tracker (green) double-staining in BMSCs stimulated with AGEs. Scale bar: 50 μm. (F) Representative Western blotting assay and quantitation of the level of LC3B, P62, Parkin, Sirt3. **p < 0.01 versus BSA. (For interpretation of the references to colour in this figure legend, the reader is referred to the Web version of this article.)
Mitochondrial dysfunction plays an important role in the generation of ROS, and dysfunctional mitochondria are removed by the process known as mitophagy [32]. The fluorescence of Mtphagy dye-stained mitochondria, colocalized with Mito-tracker green-labeled mitochondrial, was observed using fluorescence microscope. The fluorescence intensity of Mtphagy Dye and Mito-tracker green decreased in a dose-dependent manner after the BMSCs were treated with different concentrations of AGEs (Fig. 2D). LC3B is a well-established marker for autophagy [33]. In order to investigate the effects of AGEs on mitophagy, we further performed double-immunofluorescence staining for Mito-tracker-green and the autophagy-associated protein LC3B. The LC3B fluorescence and mitochondrial content decreased with increasing AGEs concentration (Fig. 2E). Moreover, we detected the expression of autophagy-related protein LC3B, P62 and mitophagy-related protein Parkin and Sirt3. As shown in Fig. 2F, the autophagy markers LC3 and mitophagy-related protein Parkin and Sirt3 decreased, whereas autophagic substrate P62 increased with the increase in AGEs concentration. Taken together, the above results showed that AGEs inhibited mitochondria function and mitophagy.
Altered mitochondrial dynamics with decreased autophagy or mitophagy are hallmarks to cellular senescence [34]. The above-mentioned data suggested that AGEs-induced BMSCs senescence is closely related to mitophagy. Therefore, we ulteriorly explored the intrinsic connections within cellular senescence and mitophagy. Carbonyl cyanide m‐chlorophenyl hydrazone (CCCP) is a potent mitochondrial membrane uncoupler to promote mitophagy [35] and cyclosporin A (CsA) is an immunosuppressant agent to inhibit mitophagy [36]. From above, we found that AGEs promoted the production of cellular ROS, reduced the mitochondrial membrane potential, inhibited mitophagy, and promoted BMSCs senescence. Here we changed mitophagy by adding CCCP and CsA to explore the role of mitophagy in BMSCs senescence. On the basis of AGEs, we added CCCP and CsA to BMSCs and then analyzed the mitochondrial function, mitophagy and senescence of BMSCs. We assessed the intracellular levels of ROS using the DCF-DA assay and detected mitochondrial ROS levels by Mito-SOX Red immunofluorescence staining in BMSCs. The results showed that CCCP inhibited the production of intracellular and mitochondrial ROS induced by AGEs, while CsA increased the production of intracellular and mitochondrial ROS induced by AGEs (Fig. 3A and B). We further tested the effects of CCCP and CsA on MMP and ATP content. The results showed that CCCP improved the reduction of MMP and ATP content induced by AGEs, while CsA reduced the reduction of MMP and ATP content induced by AGEs (Fig. 3C and Fig. S3A). Changes in mitochondrial function are capable of launching mitophagy. After supplement with CCCP and CsA separately, we used the same method to assess mitophagy in BMSCs. We observed the fluorescence of Mitophagy dye-stained mitochondria, colocalized with Mito-tracker green-labeled mitochondrial, and the autophagy-associated protein LC3B by fluorescence microscope. The results of the study found that CCCP enhanced the fluorescence intensity of Mtphagy Dye and LC3B, while CsA further reduced the fluorescence intensity of Mtphagy Dye and LC3B induced by AGEs (Fig. 3D and E). Moreover, CCCP reversed the decreased of LC3B, Parkin and Sirt3 expression and the increased of P62 expression induced by AGEs, while CsA had the opposite effect (Fig. 3F).
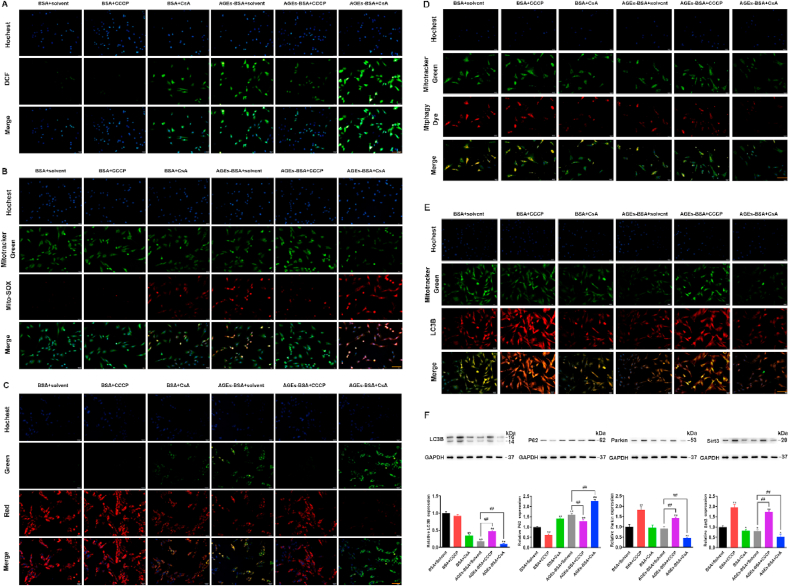
The effects of CCCP and CsA on mitochondrial function and mitophagy of BMSCs. BMSCs was treated with AGEs (200 μg/mL) for 72 h in the presence or absence of CCCP and CsA. (A) ROS production was detected with the fluorescent dye DCF (green). Scale bar: 50 μm. (B) Representative fluorescence images with Mito-SOX (red) and MitoTracker (green) double-staining in BMSCs stimulated with AGEs in the presence or absence of CCCP (10 μM) or CsA (5 μM). Scale bar: 50 μm. (C) The MMP was detected through JC-1 staining in BMSCs stimulated with AGEs in the presence or absence of CCCP (10 μM) or CsA (5 μM). Scale bar: 50 μm. (D) Representative fluorescence images with Mtphagy Dye (red) and Mito-Tracker (green) double-staining in BMSCs stimulated with AGEs in the presence or absence of CCCP (10 μM) or CsA (5 μM). Scale bar: 50 μm. (E) Representative fluorescence images with LC3B (red) and Mito-Tracker (green) double-staining in BMSCs stimulated with AGEs in the presence or absence of CCCP (10 μM) or CsA (5 μM). Scale bar: 50 μm. (F) Representative Western blotting assay and quantitation of the level of LC3B, P62, Parkin, Sirt3. *p < 0.05, **p < 0.01, versus BSA, ##p < 0.01. (For interpretation of the references to colour in this figure legend, the reader is referred to the Web version of this article.)
We examined the effects of changes in mitophagy caused by CCCP and CsA on the senescence of BMSCs. Consistent with our previous findings, AGEs induced BMSCs senescence by SA-β-gal staining (Fig. 4A). CCCP activated mitophagy and alleviated AGEs-induced BMSCs senescence, while CsA inhibited mitophagy and further promoted AGEs-induced BMSCs senescence (Fig. 3, Fig. 4A). Similarly, the activation of mitophagy by CCCP reduced the fluorescence intensity of H3K9me3 and γ-H2AX induced by AGEs, while the inhibition of mitophagy by CsA increased the fluorescence intensity of H3K9me3 and γ-H2AX induced by AGEs (Fig. 4B and C). In addition, the activation of mitophagy alleviated the inhibitory effect of AGEs on cell proliferation and increased the mRNA expression of stem-related genes Oct4 and Nanog, while the inhibition of mitophagy aggravated the inhibitory effect of AGEs on cell proliferation and reduced the expression of stem-related genes Oct4 and Nanog (Figs. S3B–D). Next, the expression of aging-related proteins P16, P21, and P53 were also tested. Compared with the AGEs alone, the addition of CCCP reduced the expression of P16, P21 and P53, while the addition of CsA increased the expression of P16, P21 and P53 (Fig. 4D).
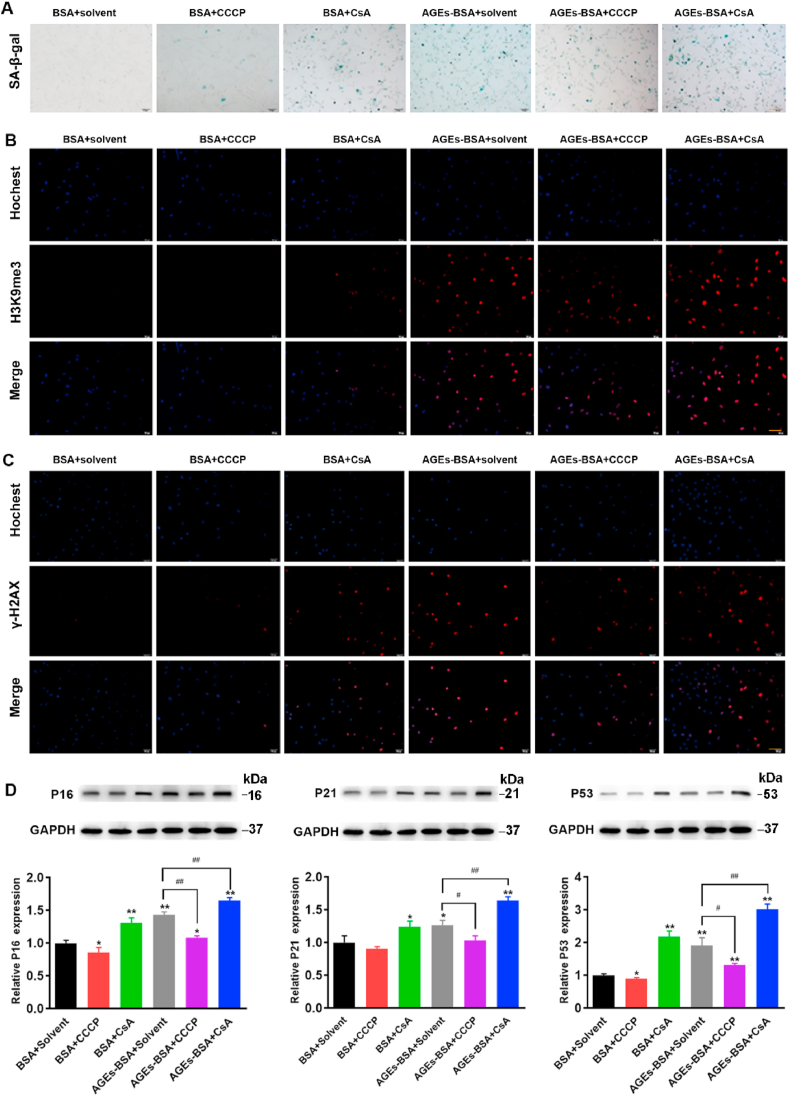
The effects of CCCP and CsA on the senescence of BMSCs. BMSCs was treated AGEs (200 μg/mL) for 72 h in the presence or absence of CCCP (10 μM) and CsA (5 μM). (A) SA-β-gal assay for detection of BMSCs senescence. Scale bar: 100 μm. (B) Detection of H3K9me3 by immunofluorescence in BMSCs. Scale bar: 100 μm. (C) Detection of γ-H2AX by immunofluorescence in BMSCs. Scale bar: 100 μm. (D) Representative Western blotting assay and quantitation of the level of P16, P21, P53. *p < 0.05, **p < 0.01 versus BSA, #p < 0.05, ##p < 0.01.
These results indicated that CCCP reduced BMSCs senescence by reversing AGEs-induced mitophagy inhibition, while CsA increased BMSCs senescence by enhancing AGEs-induced mitophagy inhibition. In summary, the senescence of BMSCs was negatively correlated to mitophagy, the senescence of BMSCs could be suppressed by the activation of mitophagy and aggravated by the inhibition of mitophagy.
BMSCs show an age-related lineage switch between osteogenic and adipogenic fates, which contributes to bone loss and senile osteoporosis [37]. Multilineage differentiation capacity of BMSCs was evaluated by subjecting BMSCs to osteogenic and adipogenic differentiation protocols and dying for lipids and mineralization respectively [38]. It was reported that the inhibition of autophagy reduced osteogenic differentiation and increased adipogenic differentiation in BMSCs [39,40]. Hence, we studied the intrinsic interaction between the mitophagy and the balance of osteogenic differentiation and adipogenic differentiation in BMSCs. In order to confirm the osteogenesis and adipogenesis of BMSCs, the BMSCs were induced to differentiate with osteogenic and adipogenic media. Osteogenic differentiation was detected by alizarin red staining (AZR) and adipogenic differentiation was determined by ORO staining. As shown in Fig. 5A–B, the results showed that the osteogenic ability of BMSCs was significantly weakened, while the adipogenic ability was significantly enhanced after treatment with AGEs. CCCP reversed the effects of AGE-induced decreased osteogenesis and increased adipogenesis, while CsA further aggravated the effects of AGE-induced decreased osteogenesis and increased adipogenesis. ALP activity, a symbolic marker of early-stage osteogenesis, was detected using an ALP activity assay kit. We found that AGEs reduced the activity of ALP, while CCCP reversed the AGE-induced reduction of ALP activity and CsA promoted this effect (Fig. 5C). We further tested osteogenic differentiation markers including Osterix, Runx2, Osteocalcin (OC) and collagen type I (Col1), and lipogenic differentiation markers including C/EBPα, PPARγ, and Twist1. As shown in Fig. 5C–J, the results of RT-PCR and WB showed that the mRNA expression levels of Osterix and Runx2 and the protein expression levels of OC and Col1 were significantly reduced by treatment with AGEs, while the mRNA expression levels of C/EBPa, PPARγ, and Twist1 were significantly up-regulated. Stimulated with AGEs and CCCP at the same time, the mRNA expression levels of Osterix and Runx2 and the protein expression levels of OC and Col1 increased significantly, while the mRNA expression levels of C/EBPα, PPARγ, and Twist1 decreased significantly. It turned out just the opposite when treated with CsA. The above results indicate that the senescence of BMSCs regulated by mitophagy plays an important role in osteogenic and adipogenic differentiation.
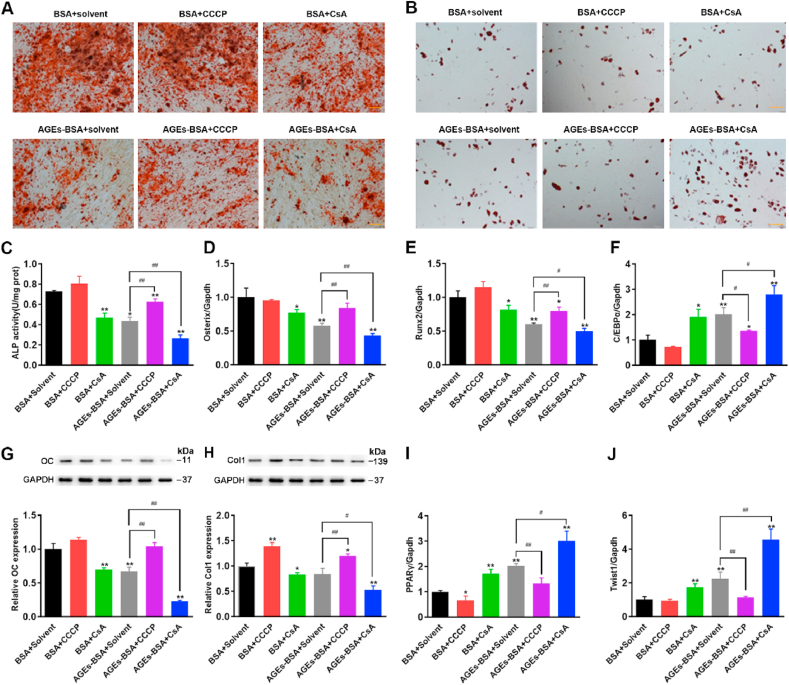
The effects of CCCP and CsA on osteogenic differentiation and adipogenic differentiation of BMSCs. BMSCs was treated AGEs (200 μg/mL) for 72 h in the presence or absence of CCCP (10 μM) and CsA (5 μM). (A–B) Osteogenic and adipogenic differentiation were tested by alizarin red staining and ORO staining, respectively. Scale bar: 100 μm. (C) ALP activity determined by ALP activity assay. *p < 0.05, **p < 0.01 versus BSA, ##p < 0.01. (D) Detection of osteogenesis marker gene Osterix by RT-PCR. *p < 0.05, **p < 0.01 versus BSA, ##p < 0.01. (E) Detection of osteogenesis marker gene Runx2 by RT-PCR. *p < 0.05, **p < 0.01 versus BSA, #p < 0.05, ##p < 0.01. (F) Detection of adipogenic differentiation-related genes C/EBPα by RT-PCR. *p < 0.05, **p < 0.01 versus BSA, #p < 0.05. (G) The protein levels of OC detected by Western blot analysis. **p < 0.01 versus BSA, ##p < 0.01. (H) The protein levels of Col1 detected by Western blot analysis. *p < 0.05, **p < 0.01 versus BSA, #p < 0.05, ##p < 0.01. (I) Detection of adipogenic differentiation-related genes PPARγ by RT-PCR. *p < 0.05, **p < 0.01 versus BSA, #p < 0.05. (J) Detection of adipogenic differentiation-related genes Twist1 by RT-PCR. **p < 0.01 versus BSA, ##p < 0.01. (For interpretation of the references to colour in this figure legend, the reader is referred to the Web version of this article.)
Mitochondrial dynamics have critical roles in cellular senescence, and their impairment represents a prominent risk factor for bone metabolic diseases [16]. Mitochondrial deacetylase sirtuin3 (Sirt3) contributes greatly to the prevention of redox stress and cellular senescence [41]. Sirt3, localized to the mitochondria where its deacetylates and activates a number of enzymes involved in modulating the mitochondrial function and ROS production, has been reported to inhibit mitochondrial apoptosis [41,42]. As mitochondria are responsible for senescence and Sirt3 is also closely related to mitochondrial function and autophagy, thus, we postulated whether Sirt3 could affect the changes in AGEs-induced mitochondrial dysfunction and mitophagy in BMSCs. Therefore, we assessed the mitochondrial ROS, intracellular ATP levels and MMP to analyze the functional status of mitochondria after silencing sirt3. Then we picked the most-efficient Sirt3 silencing siRNA by RT-PCR. Thus, we decided to continue experiments with this siRNA (Fig. S4A). We found that the silencing of Sirt3 enhanced the production of intracellular ROS (Fig. 6A) and mitochondrial ROS (Fig. 6B) and further reduced the intracellular ATP content (Fig. S4B) and MMP (Fig. 6C) induced by AGEs. Mitophagy is tightly associated with mitochondrial health and function [43]. Mitophagy selectively eliminates damaged mitochondria through autophagy pathway and protects cells from the damage of mitochondrial dysfunction and apoptosis induction [44]. We are interested in observing the effect of Sirt3 silencing on mitophagy. Then mitophagy detection was also performed using a Mtphagy Kit and a co‐localization of LC3B immunofluorescence with Mito‐tracker green‐stained mitochondria. As shown in Fig. 6D and E, AGEs increased Mtphagy and LC3B fluorescence and reduced mitochondrial content, while Sirt3 silencing further inhibited mitophagy.
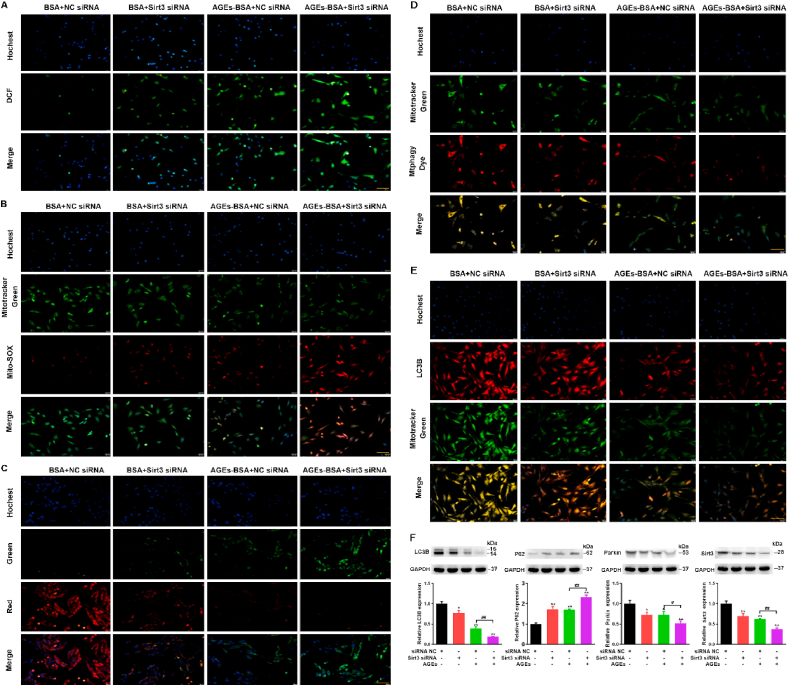
The effect of Sirt3 silencing on mitochondrial function and mitophagy of BMSCs. BMSCs were transfected with scrambled siRNA (35 nmol/L, 72 h), Sirt3 siRNA (35 nmol/L, 72 h), treated with or without AGEs. (A) ROS production was detected with the fluorescent dye DCF (green). Scale bar: 50 μm. (B) Representative fluorescence images with Mito-SOX (red) and MitoTracker (green) double-staining in BMSCs stimulated with AGEs. Scale bar: 50 μm. (C) The MMP was detected through JC-1 staining in BMSCs stimulated with AGEs. Scale bar: 50 μm. (D) Representative fluorescence images with Mtphagy Dye (red) and Mito-Tracker (green) double-staining in BMSCs stimulated with AGEs. Scale bar: 50 μm. (E) Representative fluorescence images with LC3B (red) and Mito-Tracker (green) double-staining in BMSCs stimulated with AGEs. Scale bar: 50 μm. (F) Representative Western blotting assay and quantitation of the level of LC3B, P62, Parkin, Sirt3. *p < 0.05, **p < 0.01 versus BSA, #p < 0.05, ##p < 0.01. (For interpretation of the references to colour in this figure legend, the reader is referred to the Web version of this article.)
To further investigate the effects of Sirt3 on AGEs-induced mitophagy, we detected the expression of LC3B, P62, Parkin and Sirt3. On the basis of AGEs treatment, the silencing of Sirt3 further inhibited the expression of LC3B, Parkin, Sirt3 and promoted the expression of autophagy substrate P62 (Fig. 6F). Overall, Sirt3 silencing further aggravated the AGEs-induced mitochondrial dysfunction and the inhibition of mitophagy.
Previous studies have confirmed that altered mitochondrial dynamics with decreased autophagy or mitophagy are hallmarks of cellular senescence [45]. A decline in mitochondrial quality and activity has been associated with normal aging and correlated with the development of an abundant age-related diseases [46]. Mitophagy is an important mitochondrial quality control mechanism that eliminates damaged mitochondria. The above-mentioned results suggested that Sirt3 has a crucial effect on mitochondrial function and mitophagy, so we investigated the effect of Sirt3 on AGEs-induced senescence in BMSCs. SA-β-gal assay showed that Sirt3 silencing aggravated AGE-induced BMSCs senescence (Fig. 7A). H3K9Me3 and γ-H2AX are considered to be signs of cell damage and senescence. Similarly, we observed the enhanced fluorescence of H3K9Me3 and γ-H2AX after Sirt3 silencing (Fig. 7B and C). In addition, the silencing of Sirt3 inhibited cell proliferation and reduced the mRNA expression of Oct4 and Nanog in BMSCs (Figs. S5A–7C). Next, we also examined the expression of the aging-related proteins P16, P21, and P53. Our results showed that the silencing of Sirt3 further increased the expression of P16, P21 and P53 compared with the AGEs alone (Fig. 7D). Above results pointed out that Sirt3 silencing enhanced the AGEs-induced BMSCs senescence.
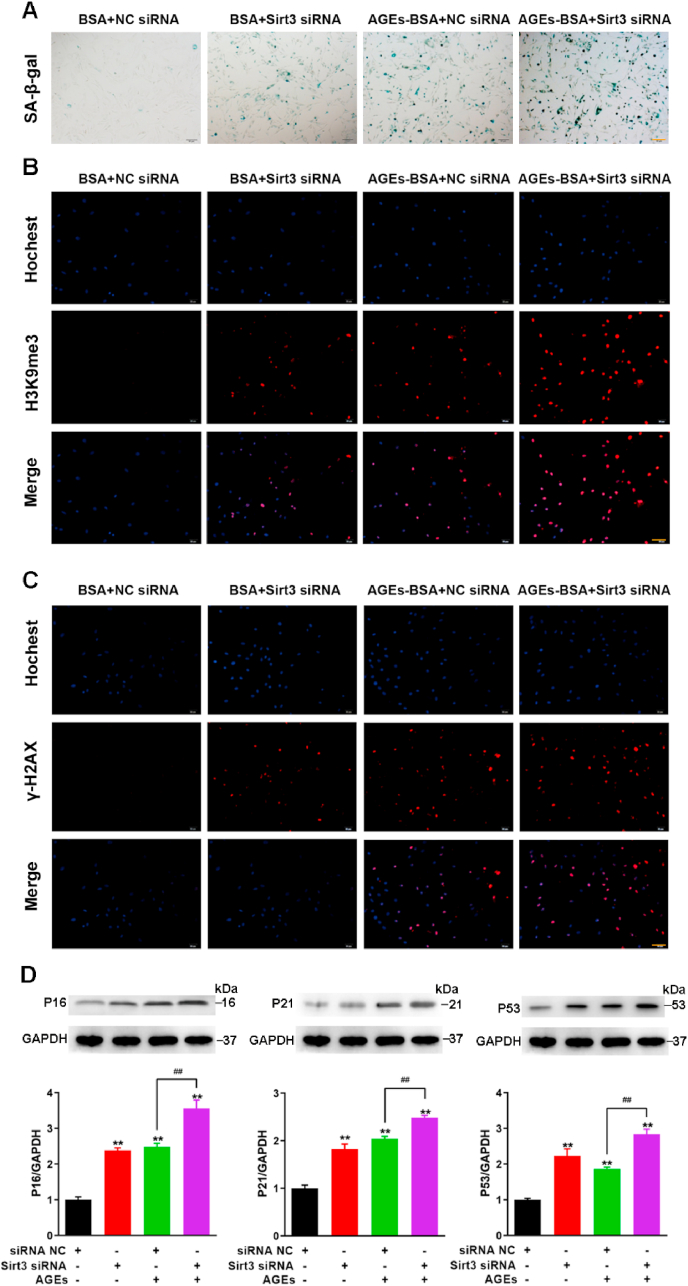
The effect of Sirt3 silence on BMSCs senescence. BMSCs were transfected with scrambled siRNA (35 nmol/L, 72 h), Sirt3 siRNA (35 nmol/L, 72 h), treated with or without AGEs. (A) SA-β-gal assay for detection of BMSCs senescence. Scale bar: 100 μm. (B) Detection of H3K9me3 by immunofluorescence in BMSCs. Scale bar: 100 μm. (C) Detection of γ-H2AX by immunofluorescence in BMSCs. Scale bar: 100 μm. (D) Representative Western blotting assay and quantitation of the level of P16, P21, P53. **p < 0.01 versus BSA, ##p < 0.01.
Given that downregulation of Sirt3 impaired mitochondrial function and mitophagy process, both of which were closely associated with BMSCs senescence, we hypothesize that Sirt3 could delay the process of BMSCs senescence by regulating mitophagy, which affects the osteogenic differentiation and adipogenic differentiation of BMSCs. The study suggested that mice lacking Sirt3 develop several aging-related diseases, which could be considered as a model of accelerated aging [41]. In order to confirm the role of Sirt3-mediated mitophagy in AGEs-induced BMSCs senescence, we overexpressed the Sirt3 gene in aging model mice through a viral system and observed the aging situation in vivo. We adopted SAMP6 mice, a model of SOP, and transfected with AAV-control-EGFP or AAV-Sirt3-EGFP overexpressing adenovirus (Fig. 8A). Four weeks after injection of AAV-EGFP-Sirt3-Flag or AAV-EGFP-control, we first tested the transfection of AAV to ensure the overexpression of sirt3 in vivo. The fusion protein FLAG was expressed in SAMP6 mice injected with AAV-Sirt3 and the fluorescence of EGFP was shown in live imaging (Figs. S6A and E). After intravenous injection of AGEs (50 ug/mouse/2 weeks) for a period of time, BMSCs were extracted and tested for cell senescence, mitochondrial function and mitophagy. As shown in Fig. 8B, the results of SA-β-gal assay showed that Sirt3 overexpression reversed AGEs-induced BMSCs senescence. Moreover, the overexpression of Sirt3 reduced the expression of aging-related proteins P16, P21 and P53 (Figs. S6B–D and F–H). Meanwhile, Sirt3 overexpression improved AGE-induced mitochondrial dysfunction and mitophagy inhibition. Specifically, overexpression of Sirt3 reversed the decrease of MMP and MtphagyDye fluorescence induced by AGEs (Fig. 8C and D). Western blot results also showed that the expression of LC3B and Parkin increased, while the expression of autophagy substrate P62 decreased after overexpression of Sirt3 (Fig. S6I-P). These results suggested that Sirt3 improved mitochondrial function and activated mitophagy to reverse AGE-induced BMSCs senescence.
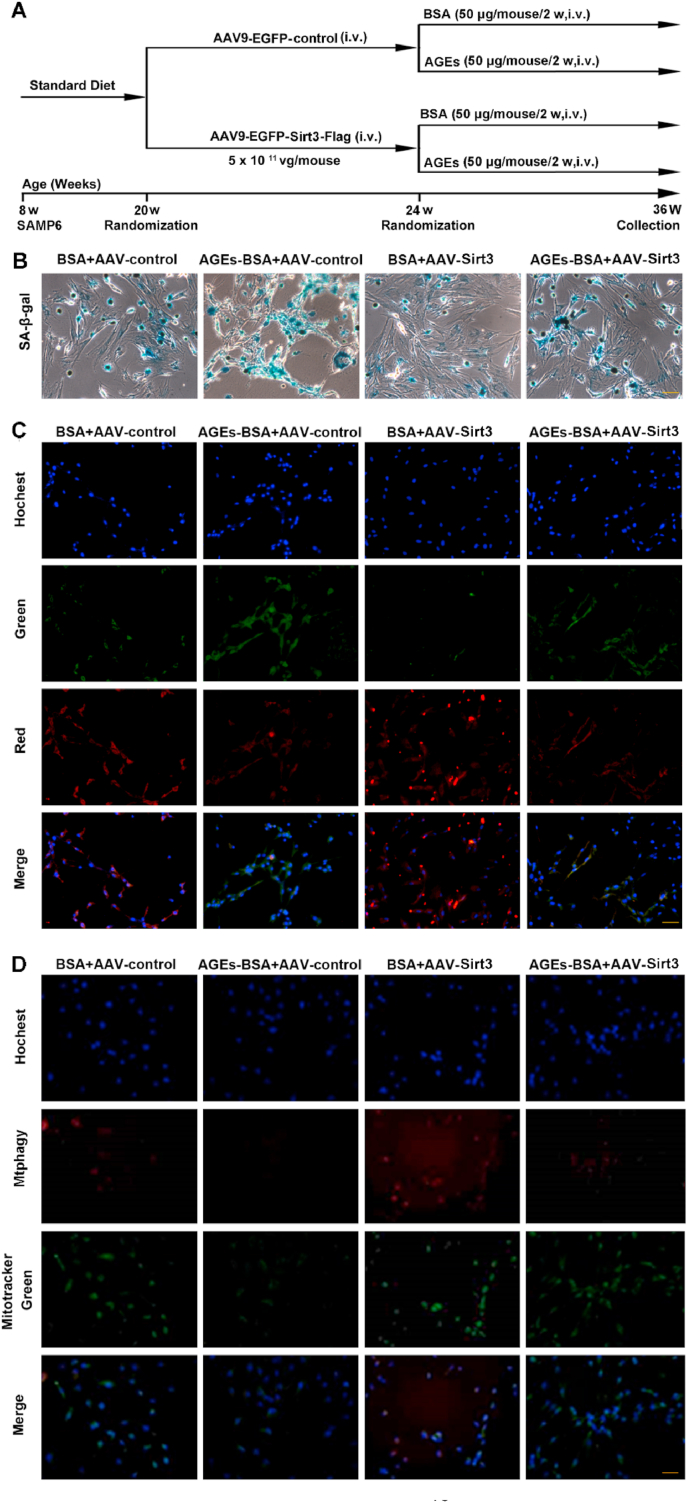
Observed the effect of BMSCs mitophagy and senescence after overexpression of Sirt3 gene by adeno-associated virus vector in SAMP6 mice. (A) The protocol used for the analysis of the effects of Sirt3. (B) SA-β-gal assay for detection of BMSCs senescence. Scale bar: 50 μm. (C) The MMP was detected through JC-1 staining in BMSCs stimulated with AGEs. Scale bar: 50 μm. (D) Representative fluorescence images with Mtphagy Dye (red) and Mito-Tracker (green) double-staining in BMSCs stimulated with AGEs. Scale bar: 50 μm. (For interpretation of the references to colour in this figure legend, the reader is referred to the Web version of this article.)
The generation and accumulation of AGEs in a process of aging are well-known nowadays. There is incremental evidence indicating that AGEs can deteriorate physiological function, destroy structural integrity, elicit oxidative stress and inflammatory reactions, and eventually lead to various aging-related diseases [47]. Sirt3-mediated mitochondrial homeostasis could rejuvenate senescence of stem cells, thus reversing aging-related degeneration [11]. Bone homeostasis is dependent on the balance between osteogenesis and adipogenesis of BMSCs, osteogenic differentiation and adipogenic differentiation seem to be competitive and reciprocal. The imbalance may give rise to osteoporosis, displaying the reduced bone formation accompanied with the cumulation of bone fat. We examined the osteogenic and adipogenic potential of BMSCs after overexpressing Sirt3 and then treated with AGEs in SAMP6 mice. As shown in Fig. 9A and B, the osteogenic potential of BMSCs treated with AGEs were weakened and adipogenic potential increased, while overexpression of Sirt3 increased the osteogenic potential of BMSCs and weakened the adipogenic potential. Bone quality has always been an important indicator for evaluating osteoporosis and bone-related diseases. Micro-CT analysis of trabecular bone parameters. Histomorphometric analysis showed that bone density, and trabecular bone volume were significantly reduced after treatment with AGEs. However, after overexpression of Sirt3, the osteoporosis-promoting effect was alleviated (Fig. 9C and S6Q). Serum bone alkaline phosphatase (ALP) activity is an early marker of osteoblast differentiation and tartrate-resistant acid phosphatase isoform 5b (TRAP5b) is an osteoclastic molecule. The detection of the activity of ALP and TRAP5b showed that AGEs inhibited the secretion of the osteoblastic molecule ALP and promoted the secretion of the osteoclast molecule TRAP5b, while the overexpression of Sirt3 promoted the secretion of ALP and reduced the secretion of TRAP5b, indicating that Sirt3 plays an important role in the formation of osteoporosis (Fig. 9D and E).
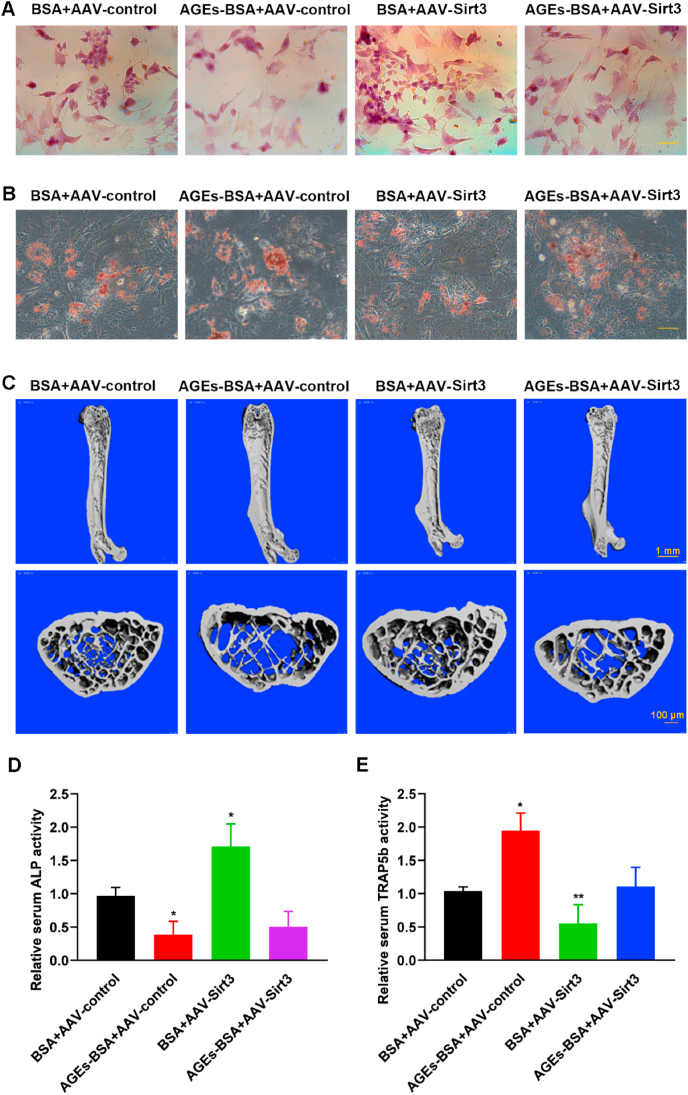
Observed the effect on SOP after overexpression of Sirt3 gene by adeno-associated virus vector in SAMP6 mice. (A) Osteogenic differentiation was detected by alizarin red staining in BMSCs. Scale bar: 50 μm. (B) Adipogenic differentiation was tested by ORO staining in BMSCs. Scale bar: 50 μm. (C) Representative micro-CT images of the distal femurs in SAMP6. (D) ALP activity determined by ALP activity assay. *p < 0.05, versus BSA. (E) TRAP5b activity determined by TRAP5b activity assay. *p < 0.05, **p < 0.01 versus BSA. (For interpretation of the references to colour in this figure legend, the reader is referred to the Web version of this article.)
As a result of bone-related aging diseases, SOP is one of the most common type of osteoporosis, which result in increasing risk to fragility fractures among the elderly [48,49]. However, the pathogenesis of SOP is very complicated and the precise mechanisms in the occurrence and development of SOP have not yet been completely illuminated. The pathogenesis of osteoporosis involves many factors and links, among which the senescence of BMSCs plays an important role. Our present study demonstrated that AGEs promoted BMSCs senescence and accelerated the occurrence and development of osteoporosis by inhibiting the mitophagy, which reduced the osteogenic differentiation and increased the adipogenic differentiation of BMSCs. Furthermore, Sirt3 promoted osteogenesis and attenuates adipogenesis in AGEs-treated BMSCs by regulating mitophagy and senescence. In conclusion, our data demonstrated that Sirt3 protects against AGEs-induced BMSCs senescence and osteoporosis through the activation of mitophagy. Targeting Sirt3 to enhance mitophagy may represent a potential therapeutic strategy for attenuating age-associated osteoporosis.
AGEs are polymers formed from nonenzymatic glycation reactions between carbohydrates and proteins, which are stable to enzymes and not easily eliminated. Studies have shown that accumulation of AGEs in tissues during aging has been associated with various pathophysiological consequences such as osteoarthritis and osteoporosis [50]. The accumulation of AGEs in the bone marrow is a feature of aging, a process of progressive decline in the biological functions and the resistance of cells, tissues and organs to various stresses gradually decreases [51]. Cell senescence is cell cycle arrest resulting in declines of cellular function and resilience. The key signal components of the aging mechanism, such as P16, P21, P53 and the trimethylation of histone H3 lysine 9 (H3K9me3), also serve as key regulators of stem cell function [52]. The expression level of β-galactosidase and γ-H2AX in cells increases accompanied with the aging of cells, which are the significant basis for the identification of cell senescence [53]. Many previous studies demonstrated that the oxidative environment of osteoporosis facilitated BMSCs senescence by means of inducing mitochondrial dysfunction and excessive ROS production [[54], [55], [56]]. In recent years, more and more evidences have shown that autophagy plays an important role in maintaining the balance of bone metabolism, which change is an significant cause of osteoporosis [57]. AGEs could affect cell function and activate autophagy via ROS, while in turn autophagy could protect cells against AGEs-caused dysfunction [58]. In our study, we found AGEs produced a large number of ROS, which could damage mitochondrial function and inhibit mitophagy, ultimately leading to cell senescence. AGEs decreased the ratio of LC3B/LC3A and increased P62 expression, suggesting that AGEs could simultaneously inhibit mitophagy.
Increasing evidence suggested that a main cause of primary osteoporosis was the senescence of BMSCs, which gradually affected the stem cell-like properties and ultimately disturbed the balance of osteogenic and adipogenic differentiation of BMSCs [19,48]. The balance between osteogenesis and adipogenesis plays an important role in the occurrence and development of osteoporosis [59,60]. Promoting the osteogenic differentiation and/or inhibiting the adipogenic differentiation of BMSCs are considered as promising strategies for the development of anti-osteoporosis. Accumulating evidence suggested that the intrinsic properties of BMSCs such as osteogenic and adipogenic differentiation potential were markedly changed during aging process [61]. An aggravating in cell senescence could be due to an increase in age-dependent damage to mitochondria or an age-dependent decline in mitophagy, eliminating dysfunctional mitochondria. Evidence indicated that the level of mitophagy markedly reduced during normal aging in BMSCs [62]. Our results showed that the activation of mitophagy by CCCP reduced BMSCs senescence, enhanced osteogenic differentiation and weakened adipogenic differentiation, while CsA showed the opposite results by inhibiting mitophagy in AGEs-treated BMSCs. In addition, the activation of mitophagy by Sirt3 overexpression further verified the significant role of mitophagy in the BMSCs senescence and osteoporosis in vivo, indicating that osteoporosis is functionally linked with mitophagy, which have a central role in the aging process and cell senescence.
Sirt3 is a major mitochondrial deacetylase and affects most key aspects of mitochondrial homeostasis, including ROS generation, ATP synthesis, mitochondrial dynamics and mitophagy [63,64]. Mitochondrial localization of Sirt3 play an essential role in various mitochondrial functions, such as maintaining basal ATP level and regulating ROS generation [65,66]. Our study found that Sirt3 silencing increased ROS levels through several mechanisms, thereby inhibiting mitophagy and promoting BMSCs senescence. In addition, Sirt3 overexpression significantly activated mitophagy, inhibited cell senescence and enhanced osteogenic differentiation in vivo, suggesting that Sirt3 regulated bone homeostasis through modulating mitophagy. Meanwhile, we further detected the changes of BALP and TRAB5b expression in the serum of SAMP6. ALP and TRAB5b are the marker proteins for bone transformation, which are closely associated with bone resorption, formation and mineralization. The activity of ALP decreased and the activity of TRAB5b increased, while Sirt3 overexpression reversed this AGEs-induced effect in SAMP6 mice treated with AGEs. What’s more, the decrease in the number of trabecular bones and the increase in trabecular spacing caused by AGEs were reversed by the overexpression of Sirt3. Our preliminary data showed Sirt3 induced autophagy, leading to retardation of BMSCs senescence mediated osteoporosis. However, the specific mechanisms of activating mitophagy by Sirt3 and the changes of related signaling pathways need to be further studied. With in-depth studies, the relationship between BMSCs senescence, mitophagy, and aging-associated diseases including osteoporosis will be clarified.
The current study represented the first demonstration of the protective role of Sirt3 in AGEs-induced osteoporosis (Fig. 10). Previous data showed that mitophagy played an important role in cellular senescence and senescence-related osteoporosis [67,68]. We further clarified that Sirt3 could delay BMSCs senescence and present favorable anti-osteoporotic effect by activating mitophagy. The importance of these findings is that it supplied a potential target for the therapeutic intervention of SOP.
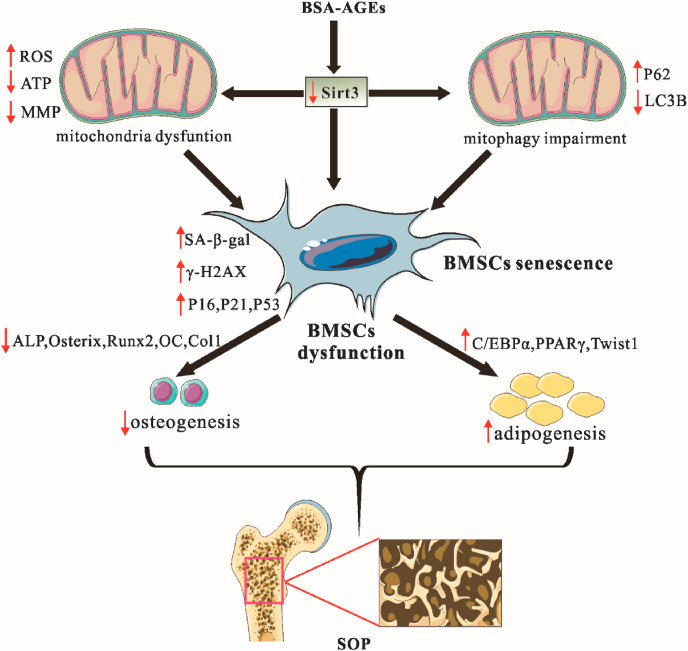
Schematic illustrating the mechanism of Sirt3-mediated mitophagy regulated AGEs-induced BMSCs senescence and senile osteoporosis.
All authors have approved the final version of the manuscript and declared that no competing interest exists.
1
2
3
4
5
6
7
8
9
10
11
12
13
14
15
16
17
18
19
20
21
22
23
24
25
26
27
28
29
30
31
32
33
34
35
36
37
38
39
40
41
42
43
44
46
47
48
49
50
51
52
53
54
55
56
57
58
59
60
61
62
63
64
65
66
67
This study was supported by the
 Sirt3-mediated mitophagy regulates AGEs-induced BMSCs senescence and senile osteoporosis
 Facebook
 Twitter
 Linkedin
 Whatsapp
