
These authors contributed equally
Lead Contact
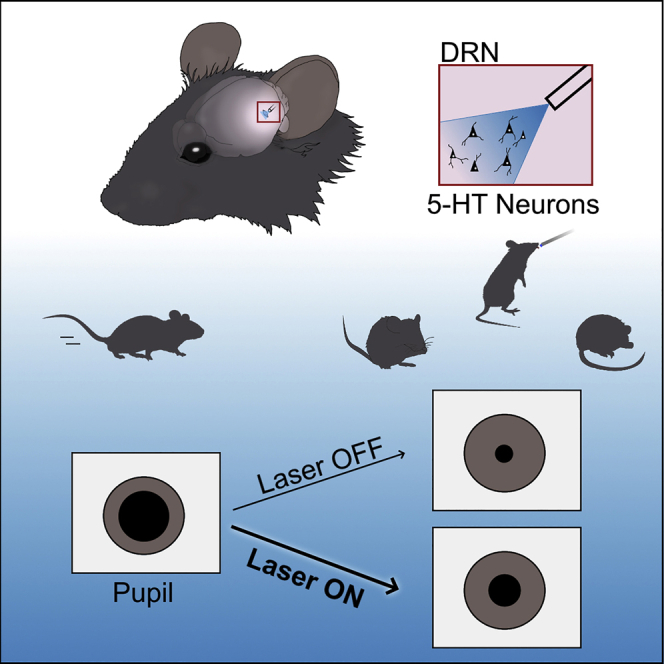
Transient variations in pupil size (PS) under constant luminance are coupled to rapid changes in arousal state,1, 2, 3 which have been interpreted as vigilance,4 salience,5 or a surprise signal.6, 7, 8 Neural control of such fluctuations presumably involves multiple brain regions5,9, 10, 11 and neuromodulatory systems,3,12,13 but it is often associated with phasic activity of the noradrenergic system.9,12,14,15 Serotonin (5-HT), a neuromodulator also implicated in aspects of arousal16 such as sleep-wake transitions,17 motivational state regulation,18 and signaling of unexpected events,19 seems to affect PS,20, 21, 22, 23, 24 but these effects have not been investigated in detail. Here we show that phasic 5-HT neuron stimulation causes transient PS changes. We used optogenetic activation of 5-HT neurons in the dorsal raphe nucleus (DRN) of head-fixed mice performing a foraging task. 5-HT-driven modulations of PS were maintained throughout the photostimulation period and sustained for a few seconds after the end of stimulation. We found no evidence that the increase in PS with activation of 5-HT neurons resulted from interactions of photostimulation with behavioral variables, such as locomotion or licking. Furthermore, we observed that the effect of 5-HT on PS depended on the level of environmental uncertainty, consistent with the idea that 5-HT could report a surprise signal.19 These results advance our understanding of the neuromodulatory control of PS, revealing a tight relationship between phasic activation of 5-HT neurons and changes in PS.

•
Phasic optogenetic activation of DRN 5-HT neurons increases pupil size
•The effects of 5-HT neuron activation are not specific to behavioral states
•The effects of 5-HT on pupil size are linked to the level of uncertainty
The effects of serotonin (5-HT) on pupil size have not been investigated in detail. Cazettes et al. show that phasic optogenetic activation of 5-HT neurons causes pupil size changes in mice performing a foraging task. The 5-HT effects on pupil size are not specific to behavioral variables but appear to be linked to the task statistics.
We tracked pupillary fluctuations while head-fixed mice foraged for water. Mice had the choice to exploit one of two resource sites (Figure 1A). Reward delivery at a given site was probabilistic (given by PREW) and switched stochastically to 0 after a variable number of licks, controlled by the probability of site depletion (PDPL; STAR Methods).25 Mice were trained to remain still while licking at a given site and to run a set distance on a treadmill to switch between sites (Figure 1B). Consistent with previous reports,1,26,27 we observed a tight relationship between PS and locomotor states (Figure 1C; across sessions, cross-correlation maximum r = 0.44 ± 0.13, p < 10−7; Figures S1A and S1B). Specifically, the transition from stillness to locomotion was accompanied by a transient increase in PS that remained elevated until locomotion offset (Figure 1D), and locomotion offset was followed by a gradual decrease in PS (Figure 1E).1,2,27 PS also varied spontaneously during stillness epochs (Figure 1C, event 3; Figure S1C) and with licks (Figure 1F; mean ± SEM of the maximum change, 3.6% ± 0.6%), but less than with locomotion (16% ± 1%), suggesting different arousal levels across behavioral states.27,28 Finally, there was a strong relationship between baseline PS (BPS) during locomotion and PS after locomotion offset (Figure S1D) and a significant negative correlation between BPS and the number of licks (Figure S1E), whereas locomotor speed did not depend on BPS (Figure S1F).
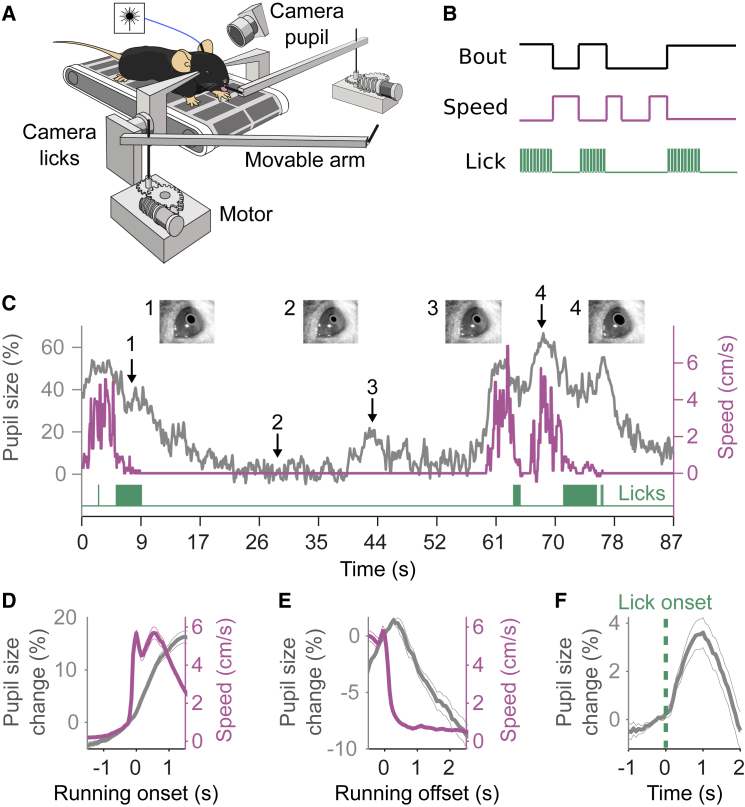
Tracking PS during a Foraging Task for Head-Fixed Mice
(A) A mouse placed on a treadmill exploits (i.e., licked for a water reward) one of two resource sites materialized by movable arms. To explore a new site, the mouse switched sides by running on the treadmill, during which time the site in front moved away, and the distal one moved into place. Licks and the pupil were tracked by two different cameras, and locomotion was monitored by the rotary encoder of the treadmill.
(B) The task consisted of periods of locomotion, during which the mice switched sites, and stillness, during which the mice licked. A behavioral bout was defined as the time spent at a given site.
(C) Example PS (major axis in gray), treadmill activity (pink), and lick time (green) from one experimental session.
(D and E) Locomotion speed and pupil response aligned to locomotion onset and offset.
(F) Lick-triggered average pupil response.
(D–F) Mean ± SEM (across sessions, n = 96 sessions from 9 mice).
See also Figure S1.
We trained mice that expressed Cre recombinase under control of the promoter of the serotonin (5-HT) transporter (SERT-Cre) and their wild-type (WT) littermates. The dorsal raphe nucleus (DRN) of both groups was infected with a viral vector containing Cre-dependent channelrhodopsin-2 and implanted with an optical fiber above the site of infection (Figure 2A; STAR Methods).29,30 Post hoc histological analyses confirmed ChR2-eYFP expression restricted to the DRN in SERT-Cre animals (Figures 2B and 2C; Figures S2A and S2B; 141 ± 57 infected 5-HT neurons per animal) and no expression in WT controls (Figure S2C).
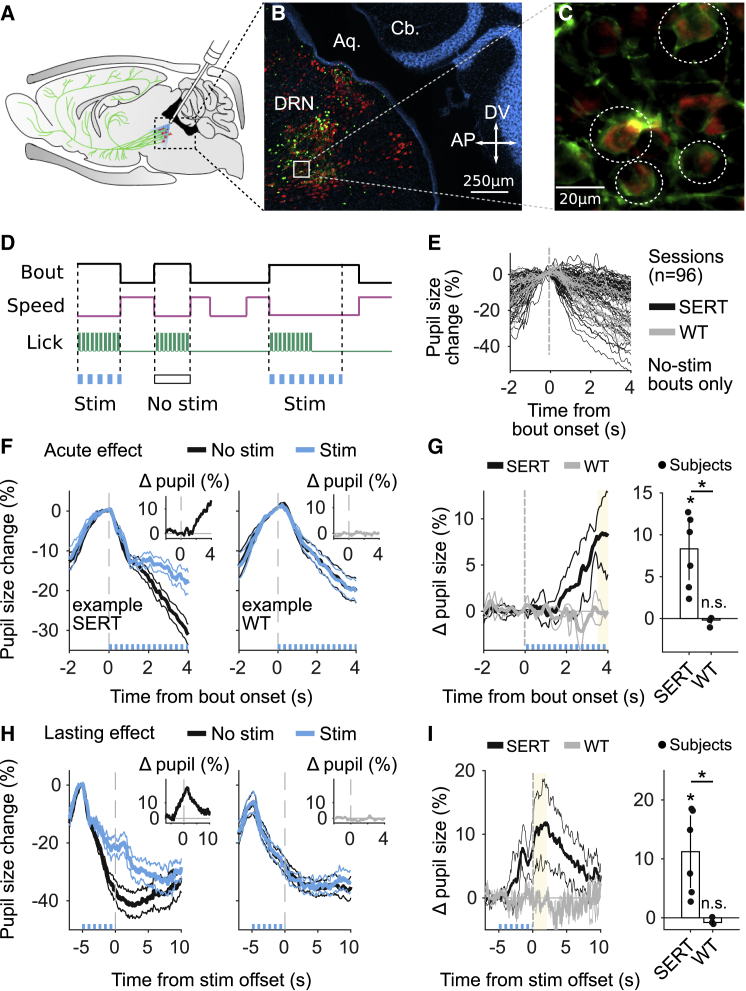
Optogenetic Activation of DRN 5-HT Neurons Increases PS
(A) Sagittal view of a mouse brain, illustrating the optogenetics approach. DRN neurons are infected with AAV2/9-Dio-ChR2-eYFP. In transgenic SERT-Cre mice (n = 6), 5-HT neurons (red) express ChR2-YFP (green) and can be photoactivated with blue light (473 nm) delivered through an optical fiber implant. The same approach is used for WT littermates (n = 3), which do not express ChR2-YFP.
(B) Fluorescence image of a parasagittal section, showing part of the DRN, aqueduct (Aq.), and cerebellum (Cb.). 5-HT neurons are labeled in red (rabbit anti-5HT), and ChR2-eYFP expression (green) is localized to the DRN (DAPI, blue). See also Figure S2.
(C) Examples of infected 5-HT neurons, circled in white.
(D) Photostimulation (10-ms pulses, 25 s−1 at 5 mW for 30% of bouts) starts at bout onset (i.e., offset of locomotion) and ends at running initiation or after 5 s of stillness. See also Figure S3.
(E) Pupil responses of non-stimulated bouts aligned to bout onset (n = 96 sessions).
(F) Time course of pupil responses aligned to the first lick of stimulated (blue) and non-stimulated (black) bouts lasting at least 4 s for two example mice (one SERT-Cre mouse and one WT mouse). The insets show the difference between pupil responses in stimulated and non-stimulated bouts (i.e., the difference between the blue and black traces [Δ PS]).
(G) Left: summary across mice of Δ PS. Right: median ± MAD across mice of Δ PS, estimated in a 0.5-s window (yellow). See also Figure S3.
(H) Time course of pupil responses aligned with stimulation offset-stimulated (blue) and -non-stimulated (black) bouts lasting at least 7 s for the same animals as in (F). Because the duration of stimulation was variable, aligning with the offset of stimulation was necessary to visualize the lasting effect of stimulation. The insets show Δ PS.
(I) Left: summary across mice of Δ PS. Right: median ± MAD across mice of Δ PS, estimated in the first 2 s after stimulation (yellow).
We randomly selected 30% of bouts to stimulate DRN 5-HT neurons and compared bouts with and without stimulation (Figure 2D). The pupil responses in non-stimulated bouts were variable but indistinguishable between SERT-Cre and WT mice (Figure 2E; p = 0.71; STAR Methods). However, we observed a significant increase in PS during photostimulation in SERT-Cre mice (median ± MAD, 8.3% ± 3.9%, p = 0.03) but not in the WT (−0.18% ± 0.23%, p = 0.5; Figures 2F and 2G; Figure S3), and this difference was significant when comparing SERT-Cre and WT mice (Figure 2G; p = 0.02). These effects were sustained for a few seconds after the end of photostimulation (Figures 2H and 2I; the effect lasted for 6.1 s, p < 0.05; STAR Methods), which could be explained by the combination of the slow time constant of the pupil response and the dynamics of the neuromodulatory system. Our results show that phasic stimulation of DRN 5-HT neurons transiently modulates PS.
The dependence of PS on baseline arousal levels, locomotion, and licks (Figure 1) could be modulated by DRN photostimulation. To address this, we used a linear mixed model (with “session” as the random effect; STAR Methods) to estimate the extent to which PS during stimulation depends, on a trial-by-trial basis, on BPS, locomotor speed, number of licks, and duration of stimulation (defined as 0 s for non-stimulated bouts; Figure 3A). Additional interaction terms between behavioral variables and stimulation reflect how dependence of PS on these variables is affected by stimulation (STAR Methods).
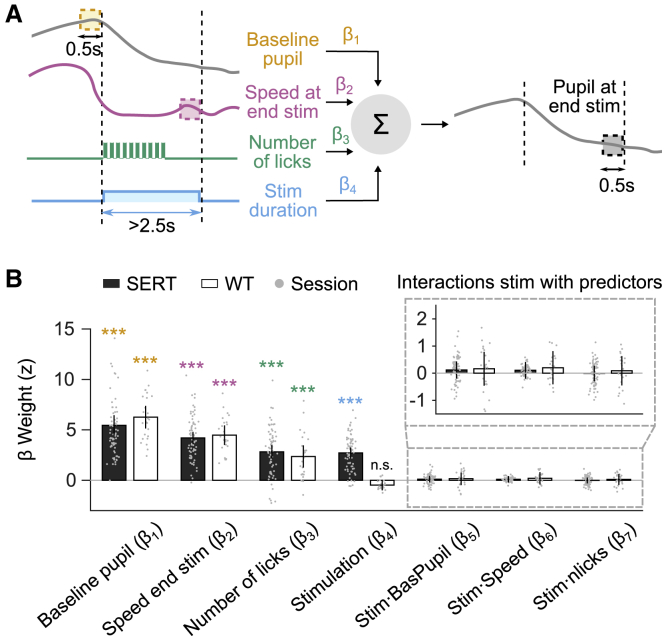
The Effects of DRN 5-HT Photostimulation Are Not Specific to Behavioral States
(A) Schematic of the linear mixed model. Four predictors are weighted and summed linearly to predict PS at the end of the stimulation epoch. For each session, the method finds the set of coefficients (β weights) applied to each predictor that best explains the PS at the end of the stimulation epoch.
(B) Linear mixed model weights for SERT-Cre and WT animals. Bars show fixed effects estimates, and error bars represent 95% confidence intervals. See also Figure S4. Gray dots indicate the estimated weights for each session.
The model fit the pupil response with high accuracy (coefficient of determination r2 = 0.75 using 5,330 bouts from 71 sessions from 6 SERT-Cre mice and r2 = 0.67 using 1,727 bouts from 25 sessions from 3 WT mice). Consistent with the results in Figure 1 and Figure S1, the behavioral predictors (baseline, speed, and licks, which were not predictive of the mouse genotype in non-stimulated bouts; STAR Methods) significantly contributed to explaining the PS for both SERT-Cre and WT mice (p < 10−4 for all; Figure 3B). Moreover, consistent with the results in Figure 2, the stimulation predictor was only significant for sessions with SERT-Cre mice (SERT, p < 10−21; WT, p = 0.08). Notably, the positive coefficients of the stimulation predictor in SERT-Cre mice indicated that the longer the stimulation duration, the greater the effect on PS. None of the interaction terms were significant in either group, indicating that the acute effect of 5-HT neuron activation on PS did not primarily depend on BPS, number of licks, or locomotor speed (see Figures S4A–S4E for similar results regarding the effects of stimulation after stimulation offset).
Changes in PS have been linked to uncertainty, from noise in integration processes31 to confidence32,33 and risk prediction errors or surprise.6, 7, 8,34 In the foraging task, different levels of uncertainty can be achieved by varying the statistics of the environment (i.e., PREW and PDPL).25 In the easy protocol, where PREW and PDPL are high, site depletion most often happens early in the bout, and a few unrewarded licks are strong evidence in favor of site depletion. Hence, there is little uncertainty about whether the site is depleted. In the more uncertain protocol, lowering PREW and PDPL leads to many unrewarded licks, which are actually just unlucky attempts at a non-depleted site. Thus, by using protocol changes, we can manipulate the level of uncertainty.
To evaluate whether the increase in PS by 5-HT neuron activation scales with uncertainty, we examined the effect of photostimulation across different protocols (easy, medium, and high uncertainty; one condition per session). We first wanted to find out how the level of uncertainty altered the behavioral variables on which PS depended (Figures 4A–4C). We found that BPS was not significantly affected by the protocol change (F(2,93) = 2.83, p = 0.06) and that the locomotor speed remained unchanged across protocols (F(2,93) = 0.68, p = 0.5). However, mice performed significantly more licks under the high uncertainty condition than under the low uncertainty condition (F(2,93) = 4.72, p = 0.01), indicating that mice adjusted their behavior to the task statistics.25 In fact, to correctly perform the task (i.e., lick until the site is depleted), mice must learn to spend more time exploiting the current site at high uncertainty, where site depletion is generally delayed compared with low uncertainty conditions. Furthermore, we observed a graded effect of 5-HT activation on PS during photostimulation (Figure 4D; F(2,66) = 4.27, p = 0.018) and after stimulation (Figure 4E; F(2,64) = 4.05, p = 0.022). Specifically, photostimulation phasically increased PS more in protocols with low uncertainty than with high uncertainty, consistent with previous work reporting that the behavioral effects of 5-HT transients35 and changes in PS6,32 depend on uncertainty. In particular, the decreasing effects of photostimulation with increasing protocol uncertainty could be consistent with the hypothesis that 5-HT transients signal a prediction error19 (here triggered artificially by photostimulation), a form of surprise reflected in transient pupil responses.6,8
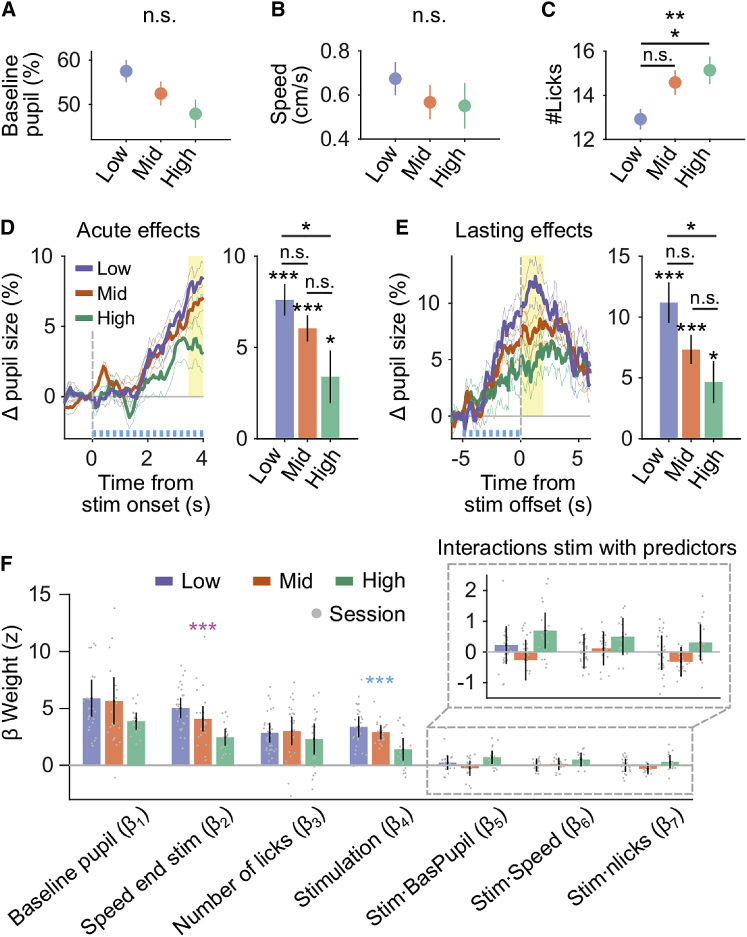
The Effects of DRN 5-HT Photostimulation Depend on the Level of Uncertainty
(A–C) BPS, locomotor speed, and number of licks across protocols (mean ± SEM across sessions; low uncertainty, n = 29; medium uncertainty, n = 24; high uncertainty, n = 18).
(D) Average change in PS of SERT-Cre mice between stimulated and non-stimulated bouts lasting at least 4 s, aligned to the first lick, and summary statistic (i.e., mean ± SEM across sessions of Δ PS estimated in a 0.5-s window, yellow). Colors represent protocols with different levels of uncertainty (low: PREW = 90%, PDPL = 30%; medium: PREW = 60%, PDPL = 20%; high: PREW = 45%, PDPL = 15%; mean ± SEM across sessions). See also Figure S4.
(E) Average change in PS of SERT-Cre mice between stimulated and non-stimulated bouts lasting at least 7 s, aligned to the end of photostimulation, and summary statistics (i.e., mean ± SEM across sessions of Δ PS estimated in a 2-s window, yellow).
(D and E) The blue trace represents stimulation duration.
(F) Linear mixed model weights for SERT-Cre mice run independently for the three different levels of uncertainty. Bars show fixed effects estimates, and error bars represent 95% confidence intervals. Gray dots indicate the estimated weights for each session.
BPS, locomotor speed, and number of licks may interact differently across protocols with the effect of photostimulation on PS. Here we again considered these variables and their interactions with the stimulation as predictors in linear mixed models that explain PS during stimulation. The models, run independently across the three different levels of uncertainty (Figure 4F), fit the pupil responses with high accuracy (low: r2 = 0.72, n = 2,047 bouts from 29 sessions; medium: r2 = 0.66, n = 1,816 bouts from 24 sessions; high: r2 = 0.73, n = 1,459 bouts from 18 sessions). The model confirmed that uncertainty modulates the effect of photostimulation on PS (F(2,68) = 9.5, p = 0.00023). Although the dependence of PS on locomotor speed also changed with the protocol (F(2,68) = 9.96, p = 0.00016), stimulation did not further influence this relationship (Figure 4F; non-significant interaction term). More generally, the differential effect of stimulation across protocols could only be observed on the stimulation predictor itself (Figures S4F and S4G), indicating that different levels of uncertainty altered the magnitude of the 5-HT effect on PS.
The control of PS likely engages multiple neuromodulatory systems with different dynamics across environmental contexts. Slow pupillary responses have been linked to tonic activity of cholinergic and noradrenergic neurons and are thought to reflect expected uncertainty, whereas transient pupil dilation in response to unexpected events is believed to coincide with phasic release of noradrenaline.12,36,37 Here we revealed a link between phasic 5-HT neuron activation and uncertainty-dependent transient pupil dilation, suggesting that phasic noradrenaline and phasic 5-HT responses could report a closely related signal. Like noradrenaline, 5-HT is known to influence the sympathetic nervous system via the hypothalamic pathway,38 but it is unclear whether 5-HT directly triggers sympathetically driven-pupil dilation.5 It has been suggested previously that the action of 5-HT on PS may be mediated by the locus coeruleus noradrenergic system,24 which receives robust projections from the DRN.39 Here, although the characteristics of the 5-HT effects could be task specific, the latency appears to be longer than that reported with noradrenergic neuron photostimulation,14 supporting the idea that DRN control of PS could be routed through the locus coeruleus. Although a relationship between locus coeruleus activity, PS and physical effort has been reported,28 here 5-HT did not affect the relationship between PS and motor behavior, stressing the intricacy of the possible synergy between 5-HT and noradrenaline.

| REAGENT or RESOURCE | SOURCE | IDENTIFIER |
|---|---|---|
| Antibodies | ||
| 5-HT (Serotonin) Rabbit Antibody | ImmunoStar | #20080, RRID: AB_572263 |
| Alexa Fluor 594 (red, goat anti-rabbit) | ThermoFisher | #R37117; RRID: AB_2556545 |
| Alexa Fluor 488 | ThermoFisher | #A11001; RRID: AB_2534069 |
| Bacterial and Virus Strains | ||
| AAV2.9.EF1a.DIO.hChR2(H134R)-eYFP.WPRE.hGH | Addgene | # 20298-AAV9 |
| Deposited Data | ||
| Compiled behavior and pupil data | This manuscript; Mendeley Data | https://doi.org/10.17632/dz8jz7k5fw.1 |
| Experimental Models: Organisms/Strains | ||
| B6.FVB(Cg)-Tg(Slc6a4-cre)ET33Gsat/Mmucd | Mutant Mouse Resource & Research Centers (MMRRC) | RRID:MMRRC_031028-UCD |
| Software and Algorithms | ||
| MATLAB | R2018a, Natick, Massachusetts: The MathWorks Inc. | https://www.mathworks.com/products/matlab.html |
| QuPath | 40 | https://qupath.github.io/ |
| Bonsai | 41 | https://open-ephys.org/bonsai |
| Other | ||
| Arduino Mega 2560 r3 | Arduino | A000067 |
| Pokes detector and valve controller | Champalimaud Hardware Platform | Mice poke simple v1.1 |
| Arduino ports interface | Champalimaud Hardware Platform | Arduino baseboard v2.2 |
| Laser | Laserglow Technologies | LRS-0473-PFF-00800-03 |
Further information and requests for resources and reagents may be directed to, and will be fulfilled by the Lead Contact, Fanny Cazettes (fanny.cazettes@neuro.fchampalimaud.org).
This study did not generate new unique reagents. All reagents are commercially available (see Key Resources Table).
All analyses were performed using custom code written in MATLAB. Original data have been deposited to Mendeley Data https://doi.org/10.17632/dz8jz7k5fw.1
A total of 9 adult male and female SERT-Cre mice (2-9 months old) were used in this study. All experimental procedures were approved and performed in accordance with the Champalimaud Centre for the Unknown Ethics Committee guidelines and by the Portuguese Veterinary General Board (Direção-Geral de Alimentação e Veterinária, approval 0421/000/000/2016). Mice were kept under a normal 12 hour light/dark cycle, and training occurred during the light period. Mice were water-restricted, and sucrose water (10%) was available to them only during the task. Mice were given 1 mL of water or 1 g of hydrogel (Clear H2O) on days when no training happened or if they did not receive enough water during the task. Mice were housed individually after surgery and water-restriction started 7 to 10 days after surgery.
We used a previously validated experimental approach to specifically target 5-HT neurons with optogenetics, which consisted of injecting double-floxed AAV-DIO-ChR2-eYFP in the DRN of transgenic SERT-Cre mice and their WT littermates.30,42, 43, 44, 45 Here, experimenters were blind to the mice’s genotype throughout the entire length of the experiment. Viral injection and fiber implantation were performed as described by Correia et al.29 Mice were anesthetized in an isoflurane induction chamber (2% for induction and 0.5%–1% for maintenance with a 1.5% mixture with O2 and a flow rate of 0.8 L·min−1) and placed in the stereotaxic frame over a heating pad with the temperature set to 37°C. Animals’ eyes were covered and protected by the application of eye ointment (e.g., Vidisic, 2 mg/ml). For the injection, a craniotomy was performed over the cerebellum (−4.7 AP). A glass pipette was loaded with the viral solution (AAV2.9.EF1a.DIO.hChR2(H134R)-eYFP.WPRE.hGH, Addgene viral prep # 20298-AAV9) and lowered to the DRN (−4.7 AP, −2.9 DV) with a 32° angle. A total volume of 1.2 mL of viral solution was injected using a Nanoject III (Drummond) at 40 nL·s-1 and at 6 different locations around the DRN. Fifteen minutes after the injections, the pipette was removed and an optical fiber (200 μm core diameter, 0.48 NA, 4–5 mm long, Doric lenses) was slowly lowered through the craniotomy so that the tip of the fiber was placed 200 μm above the target spot. Structural glue (Super-bond C&B kit) was used to fix the fiber to the skull. Carprofen solution (100 mL) was administered subcutaneously to provide analgesia. For the head plate implantation, four additional craniotomies were performed slightly anterior to the lambda stitch and four small screws (Antrin miniature specialties, 000-120x1/16) were tightened inside each craniotomy. Super-Bond was used to fix a 22.3 mm metal head plate to the screws. After surgery, mice were removed from the stereotaxic frame and returned to their home cage where they were monitored for several hours.
To assess viral expression and localization of ChR2-eYFP and optical fiber placement, we used postmortem histology at the end of the experiments. Mice were deeply anesthetized with pentobarbital (Eutasil, CEVA Sante Animale, Libourne, France) and perfused transcardially with 4% paraformaldehyde (P6148, Sigma-Aldrich). After perfusion, the brain was removed, and fixed for 24 hours in 4% PFA solution. Following fixation, the brain was transferred to phosphate buffer solution (PBS). Coronal or sagittal sections (40 μm) were cut with a vibratome (Leica VT 1000 S) and used for immunohistochemistry. Slices were washed in PBS and then blocked and permeabilized 0.3% Triton/10% FBS for 2 h. Slices were then incubated in blocking solution with primary antibody rabbit anti-5-HT (Immunostar #20080) with 0.1% sodium azide at 1/2000 dilution. Such 5-HT antibodies specifically target the soma and processes of neurons that synthetize 5-HT, and thus, have been used to control for the selective targeting of ChR2 expression to 5-HT neurons.19,46,47 Incubation occurred at room temperature in the dark, for 36 hours. Afterward, slices were washed in PBS and incubated for 2 hours (in the dark, at room temperature) with secondary antibodies Alexa Fluor 594 (red, goat anti-rabbit,ThermoFisher #R37117) and Alexa Fluor 488 (green, goat, ThermoFisher #A11001) at 1:1000 dilution. Slices were mounted in Mowiol mounting medium and DAPI and finally sealed with nail polish. Scanning images DAPI, GFP and Alexa Fluor 592 were acquired with a slide scanner fluorescence microscope (Slide Scanner Axio Scan Z1, Zeiss, Oberkochen, Germany) equipped with a digital CCD camera (AxioCam MRm, Zeiss) with a 20 × objective. Previous work using the same Cre-dependent optogenetic approach and the same mouse line, reported that 94% of ChR2-eYFP-positive neurons were serotonergic.30
Mice were head-fixed and placed on a linear treadmill with a 3D printed plastic base and a conveyor belt made of Lego small tread links. The running speed on the treadmill was monitored with a microcontroller (Arduino Mega 2560), which acquired the trace of an analog rotary encoder (MAE3 Absolute Magnetic Kit Encoder) embedded in the treadmill (speed measurements were computed as the analog signal from the rotary encoder smoothed by a median filter with a 250 ms time window and converted to cm/s). The treadmill could activate two movable arms in a closed-loop fashion via a coupling with two motors (Digital Servo motor Hitec HS-5625-MG). Water flowed through lick-ports glued at the extremities of each arm by gravity through water tubing. Water delivery was controlled by calibrated solenoid valves (Lee Company). Licks were detected in real time with a camera (Sony PlayStation 3 Eye Camera, 60 fps) located on the side on the treadmill using BONSAI.41 The behavioral apparatus was controlled by microcontrollers (Arduino Mega 2560) and I/O boards (Champalimaud Hardware platform), which recorded the time of the licks, the running speed and controlled reward delivery and depletion according to the statistics of the task. Pupil videos were acquired at 15 fps using a monochromatic USB camera after the infrared filter was removed. Infrared lights were used to illuminate the pupil.
The task for head-fixed mice was adapted from a version developed for freely moving animals.25 Here, mice collected water rewards by licking at a spout from either one of two resource sites. At any given time, only one of the sites could deliver rewards, while the other was depleted. Reward delivery was probabilistic (given by PRWD) and each lick at a fresh site could trigger a stochastic site depletion (given by PDPL). When one site switched from fresh to depleted, the other necessarily switched from depleted to fresh. Thus, mice had to infer the state of the foraging sites to best decide when to switch between sites. Running on the treadmill activated the movement of the arms to allow mice to switch between sites. Mice performed under three different conditions of uncertainty: low uncertainty with PREW 90% and PDPL 30%; medium uncertainty with PREW60% and PDPL 20%; and high uncertainty PREW 45% and PDPL 15%.
To stimulate optically ChR2-expressing 5-HT neurons, we used a laser emitting blue light at 473 nm (LRS-0473-PFF-00800-03, Laserglow Technologies, Toronto, Canada, or DHOM-M-473-200, UltraLasers, Inc., Newmarket, Canada). Light was emitted from the laser through an optical fiber patch-cord (200 μm, 0.22 NA, Doric lenses), connected to a second fiber patch-cord with a rotatory joint (FRJ 1x1, Doric lenses), which in turn was connected to the chronically implanted optic fiber cannula (M3 connector, Doric lenses). The power of the laser was calibrated before every session using an optical power meter kit (Digital Console with Slim Photodiode Sensor, PM100D, Thorlabs). The optical stimulation (10 ms pulses, 25 s-1, 5 mW) was exclusively turned on during 30% of randomly interleaved bouts, and animals were not exposed to the stimulation before being trained or outside of the foraging task. Light delivery started after the first lick was detected, and lasted up to 5 s unless the animal started running, which interrupted the stimulation. Lottem et al.48 recorded DRN electrophysiological responses in SERT-Cre mice expressing ChR2 in the DRN while optogenetically stimulating the DRN neurons using parameters similar to that of the present study. They demonstrated that 5-HT neurons reliably responded to the stimulation protocol throughout the duration of the pulse and did not detect evidence that the effects of stimulation fade away over time. Additional reports49,50 showed that increasing the pulse frequencies of the photostimulation produces a monotonically increasing dose-dependent effect. In our study, we use the pulse frequency (25 s-1) that yielded the largest behavioral response in Fonseca et al., 2015.50 These studies, together with other reports,42, 43, 44, 45 provide strong evidence that the optogenetic approach yields selective and effective activation of 5-HT neurons.
Slide scans were analyzed in QuPath40 where distinct YFP-positive cell bodies were manually counted (Figure S2). To assess the region of infection, we mapped slices comparing the DAPI staining with the Allen Mouse Brain Atlas. This was achieved using a section aligner software QuickNII (RRID:SCR_016854) to anchor a reference DAPI section to the corresponding location in Allen Mouse Brain Atlas.51 Locations of remaining sections were obtained by adding or removing 40 μm in sequential order from the reference section. The coordinates of all sections were individually estimated by matching to the high resolution Allen brain atlases (NeuN and NF-160 immunohistochemistry data; https://connectivity.brain-map.org/static/referencedata/).
Pupil size and location were estimated using custom-made MATLAB (Mathworks, R2018a) scripts. We de-noised each frame using a Wiener filter (using neighborhoods of size 5x5 pixels) and we applied lazy snapping52 to segment each frame into background and foreground. The approach consisted of two steps. First, we separated the eye from the rest of the image. Then, we separated the pupil from the rest of the eye. Both procedures were performed based on pixel-seeds corresponding to different intensities (the eye is darker than the rest of the face and the pupil is the darkest object in the eye). Intensity thresholds for performing these operations were manually adjusted for each video/session by visually inspecting 20 random frames. Once the pupil was isolated, an ellipse was fitted. “Pupil size” was estimated as the major axis of the ellipse. To directly remove outlier estimations we took advantage of the slow time constant of pupil size changes and applied a robust smoothing filter (linear, with a 250 ms window). To convert the pupil measurements (in pixels) to percent, we normalized pupil size by the median 2% smallest values. These values mainly correspond to stationary periods. We assessed the quality of the tracking by visually examining 64 random frames of each video.
To estimate pupil size changes at running onset (Figure 1D) we selected, for each session, only non-stimulated bouts with no licking during the previous 1 s (to avoid contaminations due to licking activity). For each bout, we removed the median pupil size estimated in a 500 ms window before running onset. We then considered the median pupil size across bouts for each session and then averaged across sessions. To estimate pupil size changes at running offset (Figure 1E), we selected bouts where both the current and the previous bouts were non-stimulated to exclude the lasting effects of the stimulation. Moreover, we considered only bouts that lasted at least 4 s in order to visualize the pupil decay independently from subsequent running onsets. Here, and for all the following analyses, we defined the baseline pupil size for each bout as the median pupil size estimated in a 500 ms window before running offset. Note that the baseline pupil size is generally larger than the pupil size estimated a few seconds later. This is because the baseline pupil size is estimated at the end of the running epoch, when pupil size is elevated. For Figure 1E, we subtracted for each bout the baseline pupil size, estimated medians across bouts for each session and then averaged across sessions. To estimate pupil size changes locked to licks (Figure 1F), we selected all licks in non-stimulated bouts where the average speed estimated in a 6 s window around each lick was less than 0.5 cm/s to minimize interference in the estimated pupil changes due to running. Like for the other analyses, for each lick the median values of the pupil size in the previous 500 ms were subtracted and the median was taken across bouts. Values were then averaged across sessions. To estimate the relationships between the baseline pupil size and the pupil size at the end of the bout, or the number of licks, or the locomotor speed (Figures S1D–S1F), all variables were z-scored. To estimate the effects of the stimulation we compared, for each session, the median values of the pupil size (baseline subtracted) in non-stimulated and stimulated bouts. The acute effects of the stimulation were then estimated as the difference in pupil size between stimulated and non-stimulated bouts in the 3.5-4 s after the beginning of the bout (for bouts lasting at least 4 s) and averaged across sessions. The relative number of bouts considered for non-stimulated and stimulated bouts were respectively (median ± median absolute deviation or MAD) 37 ± 29% and 34 ± 25% for SERT-Cre mice and 59 ± 16% and 57 ± 16% for WT. These values are not significantly different (all p values higher than 0.9, Wilcoxon rank-sum test with n = 6 SERT-Cre and n = 3 WT mice). We controlled for the robustness of the results on the acute effects of stimulation in different ways. First, we visually inspected whether the changes in pupil size were visible by eyes in the sessions (example in Figure S3A) before any normalization or baseline subtraction. Second, we checked the values of the baselines pupil size for stimulated and non-stimulated bouts for both SERT-Cre and WT mice and found that differences in baselines were not significantly different from zero (p = 0.58 for SERT-Cre and p = 0.18 for WT animals; Figure S3B). Then, we estimated directly the acute effects of the photostimulation without baseline subtraction and found results similar to Figure 2 (Figure S3C). Finally, we also estimated the effects of the stimulation without baseline correction but z-scoring each session (Figure S3D). Again, we found that the effect of the DRN stimulation on the pupil size was consistent with the results reported in Figure 2 computed with baseline subtraction. Taken together all these results suggest that the validity of the reported effect does not depend directly on the fine details of the analysis. To estimate the lasting effects of the stimulation (Figure 2H–2I) we considered bouts that lasted at least 7 s. This implies that the stimulation was on for 5 s and then animals did not start running for the following 2 s. The relative number of bouts considered for non-stimulated and stimulated bouts were respectively (median ± MAD) 23 ± 20% and 24 ± 20% for SERT-Cre mice and 49 ± 21% and 46 ± 20% for WT. These values are not significantly different (all p values higher than 0.7, Wilcoxon rank-sum test with n = 6 SERT-Cre and n = 3 WT mice). To address whether the trend between baseline pupil size and the level of uncertainty (Figure 4A), albeit non-significant, influenced the differential effects of the stimulation across protocols (Figure 4D),9 we computed the changes in pupil size between stimulated and non-stimulated bouts considering separately bouts with low and high baseline pupil sizes (Figures S4F and S4G). The threshold for low and high baseline was defined as the median across sessions of the baseline pupil size reported in Figure 4A.
The p value of all statistical tests are reported in the text and the significance of the tests are reported in the figures with stars (1 star for p < 0.05; 2 stars for p < 0.01; 3 stars for p < 0.001). Behavioral sessions were considered to assess the correlation between locomotion and pupil size in Figure 1. In Figure 2, we assessed the consistency of the acute effect across animals using a non-parametric test (Wilcoxon rank-sum test), either to estimate whether the median effect across mice was different from zero or to test the differences between SERT-Cre and WT mice. Specifically, to estimate the acute effects of DRN stimulation in Figures 2 and 4 we considered the difference in pupil size between stimulated and non-stimulated bouts between 3.5 s and 4 s after stimulus onset. We considered the same interval to compare pupil size values in non-stimulated bouts between SERT-Cre and WT animals (Figure 2E) using Wilcoxon rank-sum test across mice. To assess the duration of the lasting effects in Figure 2I, we shuffled stimulated and non-stimulated bouts within each session. We then defined the duration of the effect as the point in time at which the value of the difference in pupil size between stimulated and non-stimulated bouts crosses the 95th percentiles of the shuffled version (corrected for multiple comparisons with the number of comparisons equal to the number of the pupil data points). To estimate the significance of Δ pupil size in Figures 4D and 4E, we used a t test across sessions. In Figure 4, to estimate the differential effect of the uncertainty we ran a one-way ANOVA with Bonferroni corrections on the sessions (dots in Figure 4F) from the three different protocols.
We used linear mixed models,53 which are extensions of linear regression models for data that are summarized in groups, to describe the relationship between the pupil response during the stimulation and independent variables, namely the baseline pupil size, the number of licks in each bout, the locomotor speed during stimulation, the duration of the stimulation and the interactions between the stimulation and the other three variables. Separate models were run with bouts from SERT-Cre and WT mice (in Figure 3) or with bouts from different protocols of SERT-Cre mice (in Figure 4), with coefficients that varied with respect to the different sessions (i.e., the random effect). Specifically, in these models, the parameters to estimate were the fixed-effects coefficients β applied to the predictors and the variance components of the random-effect associated with individual sessions, using maximum likelihood. The models were implemented using the linear mixed-effects model function in MATLAB (fitlme). In Figure 3, the analysis was restricted to bouts where the stimulation was at least 2.5 s, which is approximately the minimum stimulation duration that yields a significant acute effect (see Figure 2G). Predictors were z-scored before fitting the data and an intercept was included in the model. To check whether the distributions of the predictors’ values were different between SERT-Cre and WT animals, we used those values in a generalized linear model (GLM) to predict whether each trial belonged to a session from a SERT-Cre or a WT mouse. We estimated the predictive power of the model using the area under the curve (AUC) of the receiver operating characteristic (ROC) estimated on testing data (10-fold for cross-validation). We then compared the value we obtained with AUC estimated shuffling mouse identity (SERT-Cre or WT) session by session. We found that the non-shuffled AUC was not statistically different from the shuffled ones (p = 0.08), suggesting that the values of the predictors alone were not informative about the genotype of the animals.
1
2
3
4
5
6
7
8
9
10
11
12
13
14
15
16
17
18
19
20
21
22
23
24
25
26
27
28
29
30
31
32
33
34
35
37
38
39
40
41
42
43
44
45
46
47
48
49
50
51
52
53
We thank Anne Urai and Constanze Lenschow for helpful comments on the manuscript and Michael Beckert for assistance with the illustrations. This work was supported by an
F.C. and J.P.M. conducted the experiments. F.C. and D.R. designed and performed the analyses. F.C. and Z.F.M. designed the experiments. F.C and D.R wrote the paper. J.P.M., A.R., and Z.F.M. reviewed and edited the paper.
The authors declare no competing interests.
 Phasic Activation of Dorsal Raphe Serotonergic Neurons Increases Pupil Size
 Facebook
 Twitter
 Linkedin
 Whatsapp
