 Photo‐Effect on Ion Transport in Mixed Cation and Halide Perovskites and Implications for Photo‐Demixing
Angewandte Chemie (International Ed. in English)


- Altmetric
Lead halide perovskites are considered to be most promising photovoltaic materials. Highest efficiency and improved stability of perovskite solar cells have been achieved by using cation and anion mixtures. Experimental information on electronic and ionic charge carriers is key to evaluate device performance, as well as processes of photo‐decomposition and photo‐demixing which are observed in these materials. Here, we measure ionic and electronic transport properties and investigate various cation and anion substitutions with a special eye on their photo‐ionic effect, following our previous study on CH3NH3PbI3, where we found that light enhances not only electronic but also ionic conductivities. We find that this phenomenon is very sensitive to the nature of the halide, while the cationic substitutions are less relevant. Based on the observation that the ionic conductivity enhancement found for iodide perovskites is significantly weakened by bromide substitution, we provide a chemical rationale for the photo‐demixing in mixed halide compositions.
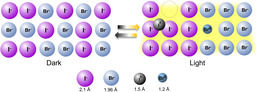
The photo‐effect on ion conduction in mixed cation and halide perovskites is studied. Unlike A‐site substitution, anion replacement is of great influence. In I‐Br mixtures the differences in hole localization and defect formation favor (reversible) photo‐demixing (the situation in the right part is simplified as the interstitial neutral iodine is further stabilized by ionic rearrangement, and the hole in the bromide is delocalized over several regular anions).
Introduction
Methylammonium lead iodide (MAPbI3) is the archetype of a whole class of halide perovskites that are in the focus of current photovoltaic research. High conversion efficiency solar cells are based on mixed cation and mixed anion halide perovskites (e.g., (FA,MA)PbI3 and (Cs,FA,MA)Pb(I,Br)3) [1] which show optimized combinations of stability and performances (FA=formamidinium). In spite of the practical relevance of these mixtures, their transport properties (and their impact on performance and stability) are yet to be systematically investigated. This especially holds for the ion transport.
For MAPbI3, the various conductivity contributions have been measured [2] and the nature of ion conduction could be safely attributed to iodide vacancies. [3] Contributions by methylammonium (MA) and Pb ions are found to be much below the anion transport values.[ 3 , 4 ] Of particular interest is the surprising finding that illumination with energies above the band gap can increase the ion conductivity—along with the electronic conductivity—by one or two orders of magnitude. [5] The photo‐induced ion conductivity is assumed to be the consequence of hole localization that neutralizes iodide locally; the so‐formed neutral iodine atoms can occupy interstitial sites where they are further stabilized by the polarizable environment in MAPbI3.[ 5 , 6 ] As a consequence the concentration of iodide vacancies (i.e., of the ionic charge carriers) is largely enhanced and the ion conductivity thus increased. This helps to drive iodine out of the sample with important implication for photo‐decomposition. A detailed understanding of the photo effect on ionic transport in mixed perovskites [7] is essential for both understanding and improving stability and device performance.
In this contribution, we report on both ionic and electronic conductivity measurements on hybrid perovskite thin films in which the A‐site cation or the anion is partially or fully substituted. Specifically we study MAPbBr3, CsPbI3, CsPbBr3, as well as FAPbI3 ‐MAPbI3 and MAPbBr3‐ MAPbI3 mixtures.
As far as the ionic transport properties are concerned, one expects major differences if the iodine is replaced by the smaller and less polarizable bromine, but lesser variations if the A‐site cation is substituted. As the polarizability is of major influence for the self‐trapping of electronic carriers, major differences are expected to occur with respect to the photo‐ionic effect, that is, the light‐induced ion conductivity. It is tempting—and we will come back to this point at the end of the paper—to connect this phenomenon with another astounding and highly debated effect, occurring in Br/I mixtures, viz. photo‐demixing: When illuminated by light with above‐band gap energies, MAPb(I,Br)3 mixtures segregate into I‐rich and Br‐rich domains. [8]
As far as the structural and electronic properties are concerned, the various endmembers are expected to show far‐reaching structural and electronic similarities but also some noteworthy differences. Notwithstanding hybridization details, in MAPbI3 the valence band is predominantly formed by I‐orbitals and the conduction band by Pb‐orbitals. Given the same structure, A‐site substitution then should not significantly change the band gap, but rather result in geometric changes. In general, FAPbI3 shows a structural instability at room temperature as it can crystallize either in a photo‐inactive, non‐perovskite δ‐phase or in a photoactive perovskite α‐phase. [9] In the purely inorganic CsPbI3, the photo‐active cubic phase changes into the more stable (but photo‐inactive) orthorhombic phase at room temperature. [10] In the case of anion substitution, more significant changes of the electronic and ionic properties are expected. The replacement of I by Br perceptibly increases the band gap from 1.6 eV to 2.4 eV (lower tendency of the bromide ion to get oxidized, that is, lower valence band maximum). [11] Under thermal equilibrium growth conditions MAPbBr3 shows p‐type conductivity according to Kelvin probe force microscopy (KPFM) measurement and DFT calculation,[ 11a , 12 ] but it is also expected to change to n‐type at very low Br2 partial pressures.
In order to separate and measure ionic and electronic conductivities in mixed cation or mixed halide perovskite materials, we performed systematic studies by using DC galvanostatic polarization experiments with ion‐blocking electrodes and together with AC impedance experiments. If bulk polarization determines the process, which is always the case for sufficiently large samples, the steady state voltage is characterized by the electronic conductivity, while the initial voltage jump is determined by the total electronic and ionic conductivity. The analysis of the polarization experiment is rather straightforward as regards the situation in the dark. We are aware of the fact that the analysis is more delicate and less clear under illumination [13] even though our previous work [5] has underpinned its relevance also under such conditions for MAPbI3. The dynamic behavior of ions and electrons under illumination deserves further investigation and is subject of our current research. For a detailed criticism the reader is referred to section 1 of the Supporting Information (Supporting Information), where we describe the assumptions of our analysis in detail. To be on the safe side, we will refer to the values of ionic conductivity under light as apparent values. These are obtained with the method used in our previous reports, which does not take frequency dependencies of the electronic response into account. It is helpful that for selected cases we also cross‐checked the ratio of ionic to electronic contributions by emf measurements. As far as the materials discussion is concerned, we will first refer to A‐site substituted compounds, then discuss their mixtures, before we turn to anionically substituted compounds and mixtures.
Results and Discussion
Let us start with A‐site substitution. As Figure 1 shows, both FAPbI3 and CsPbI3 exhibit mixed conduction as seen in MAPbI3. The electronic conductivities are of similar magnitude as for MAPbI3 and increase with decreasing band gap. We have previously shown that electron holes have a dominant contribution to the measured electronic conductivity of MAPI. We also showed that, according to the defect‐chemical analysis, the hole concentration depends primarily on the following factors: stoichiometry, doping content, halide partial pressure, formation energy of anion vacancies and valence band maximum.[ 2 , 14 ]

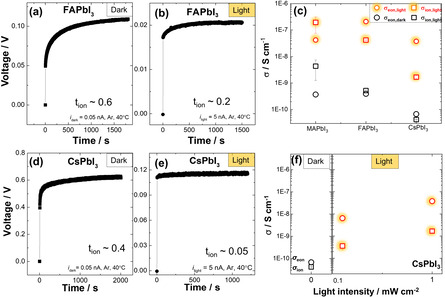
Conductivity measurement on iodide perovskites. a,b,d,e) Stoichiometry polarization curve of FAPbI3 and CsPbI3 at 40 °C under Ar atmosphere in the dark and under light (1 mW cm−2). c) Conductivity variations of iodide perovskites. All these compositions show enhancement of both electronic and ionic conductivity under light. f) Electronic and ionic conductivities of CsPbI3 as a function of light intensity. ( refers to apparent values, see text. For the estimation of the error bars, see Supporting Information section 3.)
As far as the ionic conductivities of these compositions are concerned, the value for FAPbI3 is one order of magnitude higher than for CsPbI3 and one order of magnitude smaller than for MAPbI3. This goes along with the gradation of the activation energies (0.4 eV for MAPbI3[ 5 , 15 ] and ≈0.6 eV for FAPbI3 (see Supporting Information)). This trend is expected as the migration threshold should decrease with smaller size of the A‐cation as it was observed for oxide perovskites. [16] An extreme case was recently reported for replacing MA with the large guanidinium cation resulting in a calculated migration barrier of 0.78 eV. [17] Also here it must be noted that measured activation energies contain a formation term which only disappears if the ion concentration is extrinsically dominated and association effects can be neglected. In the case of an extrinsic situation, the absolute value of the ionic defect concentration and resulting ionic conductivity will depend on the impurity content.
Next, we investigate the photo effect on ionic and electronic conductivities for the A‐cation substituted compositions. In all cases, iodide is the anion and light drastically increases both the electronic and the apparent ionic conductivities as shown in Figure 1 c. This similarity in the series of the iodide perovskites is expected in view of the fact that the phenomenon of ion conductivity enhancement is rather decoupled from the nature of the A‐cation and, thus, primarily an issue of the anion. The transients of the DC polarization yields the chemical diffusion coefficient. The observed relaxation times are for all the materials not significantly varied by illumination as long as perovskites are composed of iodide anions (cf. Supporting Information Section 3,4). This may appear surprising but it is—as discussed for MAPbI3 in Ref. [5]—rather very characteristic for a chemical diffusion, as the respective relaxation time is the product of a chemical resistance and chemical capacitance, which are oppositely influenced by carrier concentration. In the Supporting Information this is discussed in greater detail.
To investigate further the effect of the A‐cation on the behavior of hybrid perovskites under illumination, we consider conductivity measurements performed on mixed‐cation compositions. Here we show data for the case of FAPbI3/MAPbI3 mixtures. As expected, the conductivity measurements do not offer surprises for these mixtures and exhibit a rather monotonic behavior as displayed in Figure 2 with rather similar relaxation times. An increased FA concentration (x>0.2) leads to a lowering of the ionic conductivity under Ar. A similar trend is observed for measurements performed under fixed iodine partial pressure (see Supporting Information). Comparable results were obtained in an earlier preliminary study. [2] The same is true for the light intensity dependence (see Figure 1 f, Figure 2 b and data in previous work [5] ).
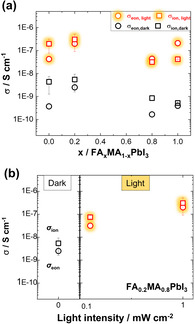
Electronic and ionic conductivity of perovskite cation mixtures in the dark and under illumination (light intensity 1 mW cm−2). a) Values for different x in (FAxMA1−x)PbI3. b) Electronic and ionic conductivities of FA0.2MA0.8PbI3 as a function of light intensity. ( refers to apparent values, see text. For the estimation of the error bars, see Supporting Information section 3.)
Now we turn to the replacement of iodine by bromine and the respective mixtures (Figure 3). Again, the variation of the electronic conductivity is parallel to the band gap variation, and presumably (and more importantly) to the variation of the valence band maximum (hole conduction) (cf. Ref. [14]). The ionic activation energy for MAPbBr3 (≈0.3 eV under Ar atmosphere) is smaller than for MAPI (≈0.4 eV), [5] reflecting the lower migration threshold for the Br‐vacancy motion owing to smaller size. This is in line with results obtained for PbI2 and PbBr2. [15] A sharp and meaningful contrast to MAPbI3 is observed for the photo effect on MAPbBr3. While the electronic conductivity is enhanced by more than one order of magnitude in MAPbBr3 illuminated with 1 mW cm−2, the effect on the ionic conductivity is weak if not zero within the error margins. As a consequence, the ionic transference number under light is 50–90 %. A much quicker polarization is observed for MAPbBr3 compared to MAPbI3, possibly related to the low hole self‐trapping for the bromide perovskite (see Figure 3 b, as discussed in Supporting Information). This smaller relaxation time corresponds to a larger chemical diffusion coefficient of the halogen and predicts a quicker out‐diffusion. This point is taken up again at the end of the paper.
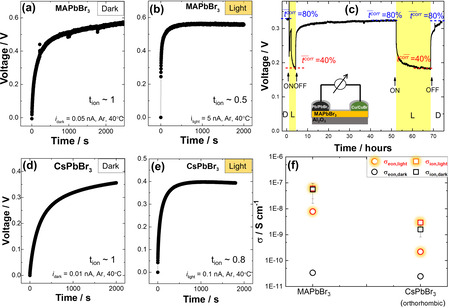
DC galvanostatic polarization measurement with ion blocking electrode at 40 °C under Ar atmosphere in the dark and under 1 mW cm−2 of light. a),b),d),e) polarization results of MAPbBr3 and CsPbBr. c) open circuit voltage measurement (corrected transference, t̄ corr, measurement) on Cu,CuBr/MAPbBr3/Pb,PbBr2 cell in the dark and under LED lamp light with 420 nm of wavelength and 4 mW cm−2 of intensity at 60 °C. f) shows the conductivity variations of MAPbBr3 and CsPbBr3 under light as extracted from polarization measurements. ( refers to apparent values, see text. For the estimation of error bars, see Supporting Information section 3.)
To double‐check that our measurements under light and in the dark indeed yield correct ionic and electronic conductivities for MAPBr3, we performed emf measurements (transference number measurements). The chemical gradient (chemical potential of bromine)[ 2 , 5 , 18 ] was established by using two different mixtures in pellet form, Cu/CuBr and Pb/PbBr2, as electrodes. The open circuit voltage of this “battery cell” was measured under dark and light conditions. The results corroborate the presence of significant ion conductivity in the dark and also under light. Note that the open circuit voltage would be zero or on the level of possible thermo‐ or photo‐ voltages, if the conductivity was purely electronic. Nonetheless, the exact deconvolution of emf and possible photovoltage contributions to the measured voltage deserves future investigations.
As shown in Figure 3 c, we derive a t ion value of ≈0.8 for the ionic transference number (t ion =σ ion/(σ eon+σ ion)) in the dark and of ≈0.4 under light when we refer to similar partial pressure as in the polarization experiment. Given the fact that these values have to be somewhat corrected to higher values (see discussion in the Supporting Information) and that the conditions are not exactly the same as for the devices used for conductivity measurements, the agreement with the polarization results is satisfactory. This evaluation is complicated by the fact that very low partial pressures are established at the contacts, but the initial high partial pressure value is still expected to dominate in the sample's interior. Details on this aspect are given in the Supporting Information section 7.
The UV/Vis/toluene experiments[ 5 , 19 ] that we used in the iodine case for revealing the kinetics of stoichiometric change were not applicable here owing to an unmeasurably low Br amount in the solvent (see Supporting Information section 6). We can attribute this either to the lower homogeneity range of MAPbBr3 (smaller achievable anion deficiency, also reflected by the fact that the chemical capacitance of MAPbBr3 is one order of magnitude smaller than for MAPbI3) or to sluggish surface kinetics (see below).
The photo‐effect on CsPbBr3 is rather analogous to MAPbBr3 as shown in Figure 3 f. The observed insensitivity of the apparent ionic conductivity on illumination for the bromide, which is in striking contrast to the iodide, is consistent with our enhancement mechanism that involves the anion directly. Bromine is electronically less polarizable and thus a stabilization of neutral interstitial defects is less likely. Zhou et al. reported activation energy results on CsPbI2Br and concluded that the effect of light‐induced ion migration can be reduced by inorganic Cs substitution. [17a] Irrespective of the fact that the activation energies only reflect the temperature dependence of the conductivity, our results clearly show that Cs‐substitution does not significantly impact the photo effect, but Br‐substitution does. It should be stressed again that the sheer redox‐effect is already “taken care of” by overcoming the band gap. The formation of the defect center is a matter of (a) hole localization and (b) defect formation energetics. The latter appears to be most important, as the band widths as rough measures of localization are reported to be similar.[ 6a , 20 , 21 ] Recent DFT‐calculations by Evarestov et al. [21] directly point towards a favorable energetics for neutral interstitial formation for the iodide while the bromide prefers the hole to be delocalized over several regular bromide ions.
We now refer to the conductivity measurements on anion mixtures. It was reported that replacement of I with 20 % of Br induces a phase change from a tetragonal to cubic phase. [22] In the anion mixtures (MAPb(I1−xBrx)3) the band gap can be tuned from 1.5 eV to 2.4 eV by controlling x.[ 11a , 22 ] In the dark, the electronic conductivity is monotonically decreased on increasing Br concentration (see Figure 4 a); again, this is consistent with the observed trend in band gap but might rather be connected with the course of the maximum of the valence band which directly influences the hole formation energy. The ionic conductivity is monotonically increased on increasing the Br content, as expected from the high values of MAPbBr3 and the absence of any crystallographic anomaly.
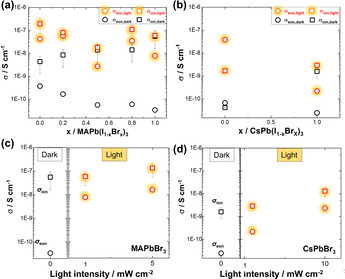
Electronic and ionic conductivity of perovskite anion mixtures in the dark and under light. a) MAPb(I1−xBrx)3 and b) CsPb(I,Br)3 (with light intensity of 1 mW cm−2). Comparison of conductivities as a function of light intensity in c) MAPbBr3 and d) CsPbBr3 under Ar atmosphere at 40 °C. Data are extracted from DC polarization measurement. ( refers to apparent values, see text. For the estimation of the error bars, see Supporting Information section 3.)
We now consider measurements under light. We already mentioned the striking difference in the electrical response of MAPbBr3 with respect to MAPbI3 occurring under illumination. Pure MAPbBr3 displays negligible change in ionic conductivity under light with respect to the dark case, while the electronic conductivity increases by two orders of magnitude under the same light intensity (the wavelength dependence is given in the Supporting Information, Figure S5). In contrast, MAPI shows an increase in both electronic and apparent ionic conductivity under light compared to the dark case. The results for the anion mixtures shown in Figure 4 a demonstrate that the apparent ionic conductivity enhancement by light is gradually reduced with increased Br content.
Considering the course of the conductivities (Figure 4 a) as well as the transients of the polarization curves (see Figure 5 a), within I/Br mixtures, one realizes two anomalies for the I0.5Br0.5 composition:
![a) Stabilization times of anion mixtures in the dark (open symbols) and under light (closed symbols with hollow). In the case of the endmembers and also generally in the dark the evaluation of the stoichiometric polarization yields a well‐defined relaxation time that can be converted into a chemical diffusion constant. The values for the mixtures under light represent simply stabilization times of conductivity measurement (1/e criterion). The value for x=0.5 only represents a lower limit (the sample did not reach complete stabilization). This clear anomaly when compared to the end‐members or to the dark situation can be attributed to demixing. Only the time constant (τδ) for the pure bromide under light is significantly smaller due to quicker polarization (cf. supplementary) b) The schematic image shows that the occurrence of hole self‐trapping in an iodine environment favors (reversible) photo‐demixing in mixture. The situation in the right part is simplified as the interstitial neutral iodine is further stabilized by ionic rearrangement (formation of di‐halide dumbbells, etc.). A more realistic hole distribution in the bromide case is given in Ref. [21].](/dataresources/secured/content-1765832949723-28800fd4-fca0-4d73-86a9-5f1a19603226/assets/ANIE-60-820-g005.jpg)
a) Stabilization times of anion mixtures in the dark (open symbols) and under light (closed symbols with hollow). In the case of the endmembers and also generally in the dark the evaluation of the stoichiometric polarization yields a well‐defined relaxation time that can be converted into a chemical diffusion constant. The values for the mixtures under light represent simply stabilization times of conductivity measurement (1/e criterion). The value for x=0.5 only represents a lower limit (the sample did not reach complete stabilization). This clear anomaly when compared to the end‐members or to the dark situation can be attributed to demixing. Only the time constant (τδ) for the pure bromide under light is significantly smaller due to quicker polarization (cf. supplementary) b) The schematic image shows that the occurrence of hole self‐trapping in an iodine environment favors (reversible) photo‐demixing in mixture. The situation in the right part is simplified as the interstitial neutral iodine is further stabilized by ionic rearrangement (formation of di‐halide dumbbells, etc.). A more realistic hole distribution in the bromide case is given in Ref. [21].
Strikingly, the nominal I0.5Br0.5 mixture shows a clear minimum in the electronic and apparent ionic conductivity under light.
The observed stabilization time for this composition is anomalously large (in fact the data point referring to x=0.5 in Figure 5 refers to a lower bound).
Both findings, that are absent under dark conditions, are in agreement with the photo‐induced demixing into I‐rich and Br‐rich phases reported in literature.[ 8a , 8c , 23 ] In such a case, long‐time morphological changes occur. These are connected with geometrical blocking effects, which affect the measured conductivity values. The changes imply that the time dependence does not follow a polarization behavior and does not allow for an extraction of a defined relaxation time, and hence of a chemical diffusion coefficient (unlike for end members and mixtures in the dark). These issues, and in particular the appropriateness of the stabilization time to map out the phase width, are the subject of ongoing work where in particular the two time scales (polarization and demixing) will have to be separated.
In order to explain the astonishing demixing effect that is well reported and extensively debated in the literature, several explanations have been proposed. DFT calculations suggested [8b] a thermodynamic phase instability at room temperature already in the dark; accordingly the photo effect would consist in enhancing the kinetics of demixing. The enabled demixing under light should then however not be reversible at all. In contrast, the experimentally observed—at least partial—reversibility indicates a thermodynamic effect; that is, a miscibility gap opens—or at least widens—under illumination due to the thus lowered Gibbs energy. This partial reversibility is also found in our work. Thermodynamic explanations in the literature are based on band gap variation, electric field or strain effects.[ 8b , 23c , 24 ] A recent compilation is given in ref. [25].
From the suggested mechanism of photo‐enhanced ion conduction, and from the difference observed for iodide and bromide perovskites, it appears natural to invoke the distinct chemical effects (i.e., self‐trapping of holes as proposed in refs[ 5 , 6 ] in the iodide but not in the bromide) for an understanding of the photo‐demixing. It is relevant here to briefly summarize our present picture of the different photo‐ionic effects with respect to halides. We assume that in the case of the iodide the hole is localized (loss of delocalization energy) and then a self‐trapped hole defect is formed that is stabilized by electronic but in particular by ionic polarization in the form of dumbbell structures or higher order aggregates.[ 6a , 6b ] Owing to a much lower electronic polarizability and in line with recent calculations, [6a] the effect is much lower and probably absent in the bromides. (In view of the high ionic conductivity contribution in MAPbI3 under light, it is highly likely that also excess electrons are trapped presumably at Pb‐sites (see also [26])).
As the incorporation of these defects introduces a negative Gibbs energy contribution (ΔG 0+ΔG configuration), and only becomes effective if I‐rich and then also Br‐rich clusters are present or formed, the segregation is favored. This is valid irrespective of ΔG 0, the non‐configurational part, being positive or negative. The assessment of the magnitude of the effects suggest ΔG 0 being negative and the number of self‐trapped holes being very large. Probably the number of trapped conduction electrons is large as well. This seems to be supported by the recent finding of a partially reversible appearance of neutral iodine and neutral lead on illumination.[ 5 , 26 ] A regular solution model (see Supporting Information section 10) indicates that the effective energy gain is on the order of several tens of meV, which suffices to destabilize the mixtures. For more details, we refer to Supporting Information section 10. This would also explain the disappearance of the demixing in grains of nanometer size, [27] as then the energy of forming an interface would outweigh the bulk free energy gain due to demixing (see analogous situation in LiFePO4 [28] ). More details are found in the Supporting Information. An in‐depth discussion of the mixture effects including strain effects must be reserved for a forthcoming paper.
At the end, let us comment on the observed higher stability of the bromide in the context of these transport studies. As addressed above and detailed in the Supporting Information, the larger trapping in the iodide case appears to be the main reason for the lower chemical diffusivity of iodine when compared to bromine. On the other hand it can lead to a lower probability of carrier recombination and thus to a higher increase of the halogen chemical potential. If we only refer to the diffusion kinetics of the intrinsic photo‐degradation, the bromide should be even less stable. At room temperature, however, the surface reaction step typically plays a decisive role.[ 7b , 29 ] Whether it is a lower surface reaction rate constant or a lower driving force that provides the higher stability of the bromide is under investigation. It is worth emphasizing that there are, in addition to the intrinsic degradation, various extrinsic channels of importance, for example, the interaction with oxygen or water traces; in these cases significant differences in the driving force exist between iodide and bromide. [30]
Conclusion
We performed a systematic study to investigate the electronic and ion conduction under light in various pure and mixed lead halide perovskites of theoretical and practical interest. We considered A‐site substitution of MAPbI3 by FA and Cs as well as anion substitution by Br. Special emphasis was laid on the photo‐effect on the ion conduction. The A‐site substitution was of minor influence, while the anionic substitution was of great influence and significantly lowered the photo‐ionic effect. (i) This corroborates our electron‐ion coupling mechanism for the photo‐enhanced ion conductivity; (ii) it also provides a rationale for a defect chemical route to the photo demixing phenomenon of halide perovskite mixtures considering the fact that the self‐trapping free energy can only be capitalized if iodide rich domains (and hence bromide‐rich domains) are formed. The energetic effects are rather small and easily overcompensated by interfacial costs resulting in a vanishing miscibility gap for a nano‐sized crystal. This study will guide future investigations to elucidate the demixing process as well as its suppression via compositional or grain size engineering.
Conflict of interest
The authors declare no conflict of interest.
Acknowledgements
Open access funding enabled and organized by Projekt DEAL.
References
1
1a
1b
2
2
3
3
4
4b
5
6
6a
6b
6c
7
7a
7b
8
8a
8c
9
9b
10
11
11a
11b
12
13
13a
13b
13c
14
15
16
17
17a
17b
18
19
20
21
23
23a
23b
23c
23d
23e
23f
24
24a
24b
24c
24d
25
25a
25b
26
26a
26b
27
27a
27b
27c
28
29
29
30